Statistics
 Call Kai
 Learn
 Practice Test
 Spaced Repetition
 Match
 Flashcards
 Knowt Play
1/19

There's no tags or description
Looks like no tags are added yet.
Name | Mastery | Learn | Test | Matching | Spaced | Call with Kai | Chat |
|---|
No analytics yet
Send a link to your students to track their progress
20 Terms
Nominal data
Incomparable. Yes/No. Healthy/Sick. These are qualitative measurements that categorize data without a natural order or ranking.
Ordinal data
Relatively comparable, like size. Example: categories or stages (of cancer). Refers to data that can be ranked or ordered, but the intervals between the ranks are not equal. Examples include rating scales, such as satisfaction levels.
Discrete data
Integer numbers. Have an order, can be compared arithmetically. -1, 0, 1, 2.
Continuous data
Real numbers. Have an order, can be compared arithmetically. Size, weight, concentration, altitude.
Frequency distribution
A summary of data that shows how often each value or range of values occurs in a dataset.
Binning
Process of grouping continuous numerical values into smaller, discrete intervals - bins. Example: x axis from 0 to 20 and we create 4 bins (0-5, 6-10, 11-15, 16-20).
Relative frequency distribution
displays the proportion, percentage, fraction of observations falling into each category or class interval of a dataset, rather then the raw count.

Cumulative frequency distribution
It’s the sum of the class and all classes below it. (are not meaningful for nominal (unordered data)).

Cumulative relative frequency distribution
Shows the running total of percentages or proportions for all data values up to a specific point. Adds up everything and the last value is 1.

Arithmetic mean
Just add everything and divide on n. Best for additive quantities, linear difference.

Geometric mean
Multiply everything and put in a ^1/n (take a root). log(GM(𝒙))=AM(log(𝒙))
For exponentially growing data, when we have extreme outliners.

Harmonic mean
Emphasis on small values. Best for rates and rations. Use to calculate speed mean.

What is smaller/bigger? AM, GM, HM?
Inequality works for positive xi values.

Median
Middle point of the dataset. Depends on parity of n. Median isn’t sensitive to extreme outliners.

Mode
The most frequently occurring observation. Makes more sense for categorical data.
Range
Range(x) = Max(x) - min(x). Highly sensitive to the extreme values of outliners.
Quantiles
The 𝑝-th quantile of 𝒙, 𝑞𝑝(𝒙), is the value such that at least a fraction 𝑝 of the observations 𝑥𝑖 are less than or equal to it. Commonly used quartiles: Q1 (25%), Q2 (50%, median), Q3 (75%). IQR (interquartile range) - Q3-Q1.
Sample Variance
Measures how far spread out the numbers are in a small group (a sample) taken from a larger group (a population).

Sample standard deviation
Measures how much data values in a subset scatter around the sample mean. Same units as the mean and data.

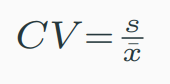
The Coefficient of Variation
also called relative standard deviation (RSD)—is a unitless, standardized measure of how spread out data points are around the mean. Is unstable when mean = 0.