Test II
 Call Kai
 Learn
 Practice Test
 Spaced Repetition
 Match
 Flashcards
 Knowt Play
1/55

There's no tags or description
Looks like no tags are added yet.
56 Terms
What are the 3 conditions for binomial distribution
Each trial has 2 outcomes
Each trial has same probability of success
Trials are independent to each other
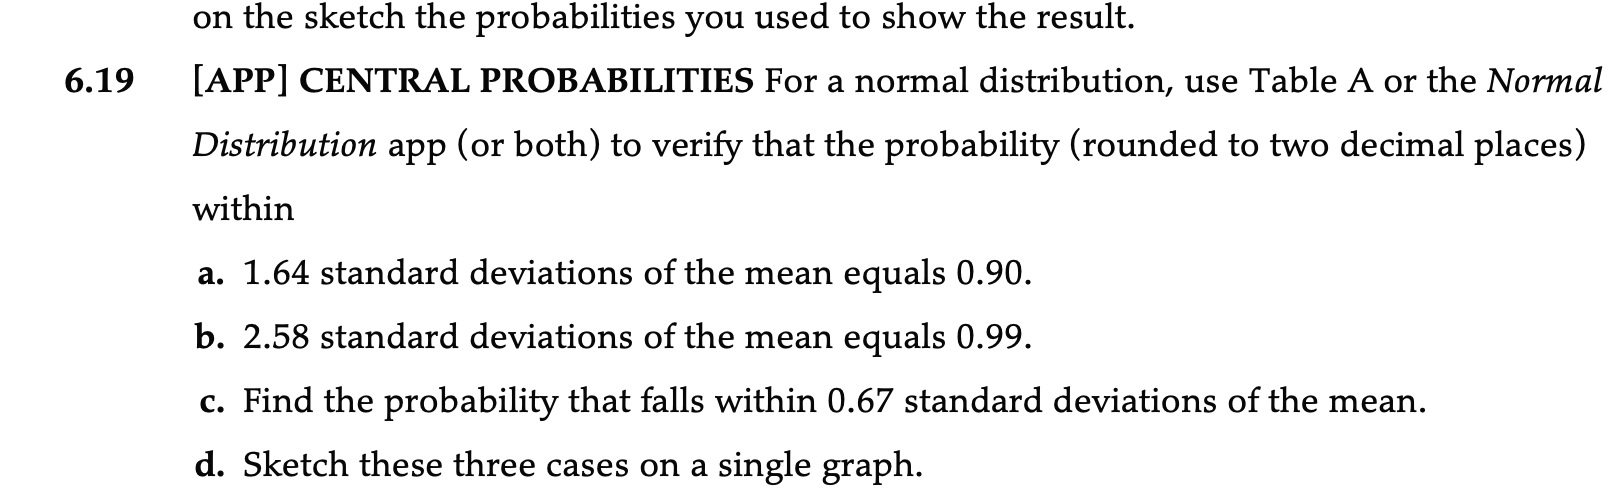
Binomial equation


When ur asked to find the probability distribution, what r u finding?
1) List all possible outcomes AND 2) the probability of each outcome
ex: a bar graph (spaces b/w) or table
What is X?
Ex: X = the number of times a 4 is rolled, rolling three times
Ex: X = 0, 1, 2, 3,
Every distribution follows which two rules?
P is between 0 and 1
the sum of the probabilities is 1

just A, B, C


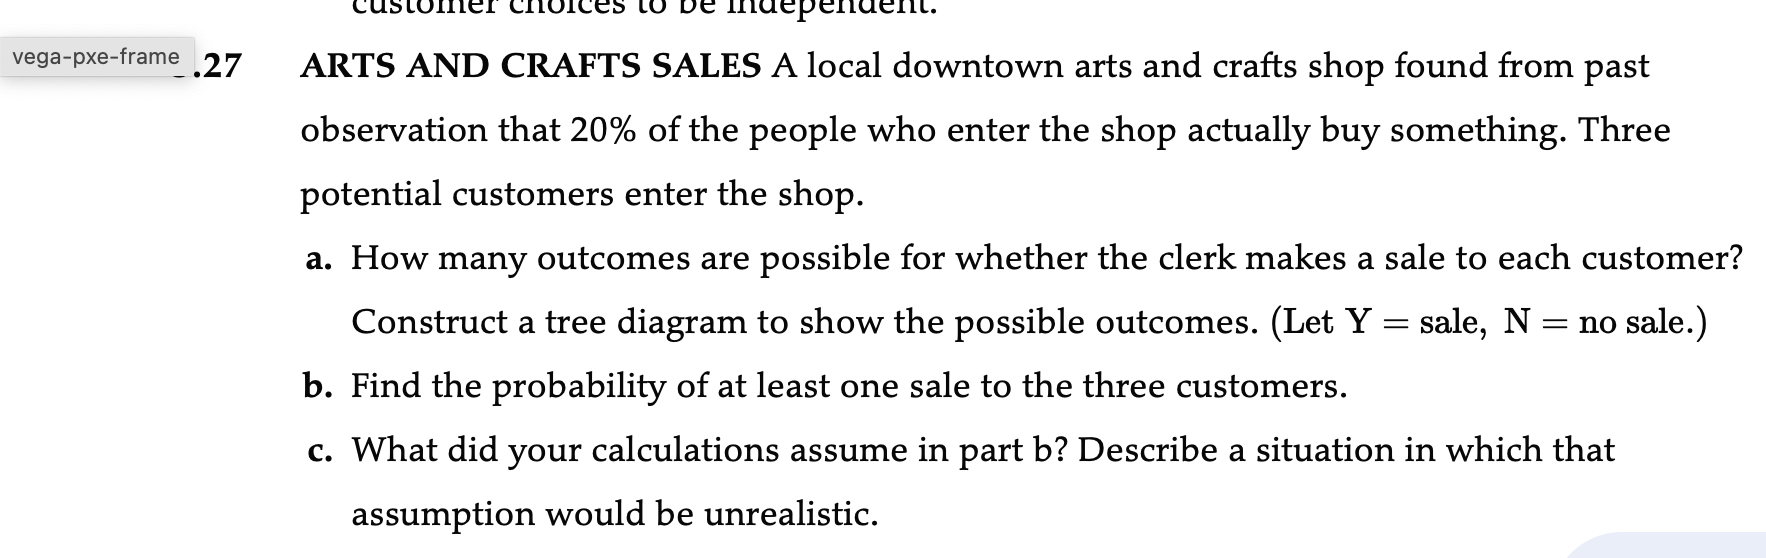
6.4 A

6.5




25/500
25/916

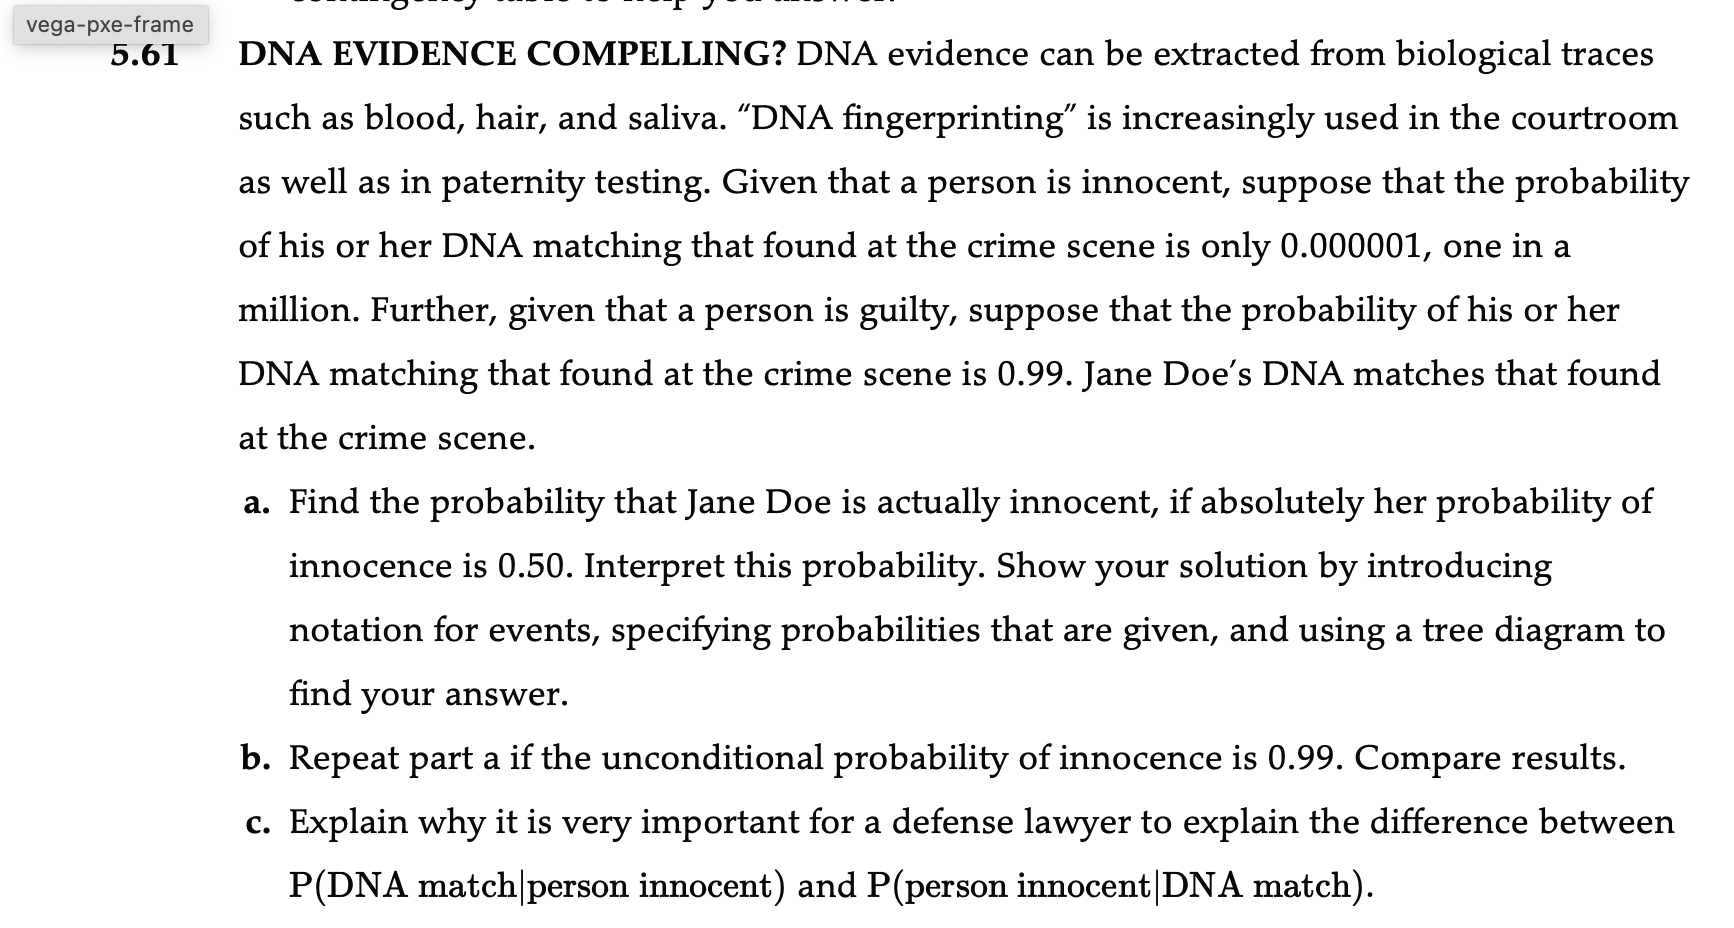
Given that there is a 50% baseline chance of innocence before looking at the DNA evidence, a DNA match makes the probability that Jane Doe is actually innocent extremely small (approximately \(0.00000101\)). This means it is almost certain she is guilty under these conditions.


What are the 6 formulas

draw the general tree diagram

what is sensitivity
true positive
what is specificity
true negative
Three rules for independence

Total outcomes #
multiple individual outcomes for each
ex: roll a die, flip a coin, roll a die = 6×2×6


write all the 6 formulas

Three rules for checking for independence
P(A|B) = P(A)
P(B|A) = P(B)
P(A and B) = P(A) * P(B)
how to get the total number of outcomes
multiply all the individual outcomes together for each
ex: roll a die, flip coin, roll a die
(2)(2)(2)
another ex: 10 question T or F test
2^10 (bc there are 2 answers and 10 questions)
Intersection
AND, both things must be true at the same time
Union
OR
Disjoint
probability of rolling a one AND no one’s (0/36) given 2 dice
Positive association
big exp variable = big response variable
Negative association
big exp variable; small response variable
Correlation formula

correlation only if there’s a __ line between the 2 variables
correlation only if there’s a straight line between the 2 variables
What does the correlation coefficient do?
What does the regression line do?
Correlation coefficient: how strong an association is
Regression line: predicts y-values when missing data
Residual definition and formula
point on line where observation would lie
actual - expected
extrapolation
prediction a variable value outside of the data set and expecting the trend to continue
for regression line, can you swap the x and y variables? Can you for the correlation coefficient?
Yes for correlation and no for regression
2 things that must be true to have influential outlier
If x-value is high or low compared to the rest of the data
if observation doesn’t lie close to the regression line

The following graph shows data on x = the number of televisions per 100 people and y = the birth rate (number of births/1,000 people) for 6 African and Asian countries. The regression line, y = 29.8 - 0.024, applies to the data for these 6 countries. Another point is added at (81,15.2), which is the observation for the United States. The regression line is y = 31.2 = 0.195x for all seven points.
A. Does the US observation appear to be an outlier on (i) X, (ii) Y, (iii) outlier relative to the regression line of the 6
B. State the two conditions under which a single point can have a dramatic effect on the slope and show that they apply here
C. This one point also drastically affects r (-0.051 without the US and -0.935 with the US). Explain how the relationship between birth rate and the number of televisions is (i) without the US point and (ii) very strong with the US point
D. Explain why the US residual for the line fitted using that point is very small.


The following table shows data on gender (1 = female, 2 = male) and preferred chocolate type (1 = white; 2 = milk; 3 = dark) for a sample of 10 students.
The teacher enters the data into a software and reports a correlation coefficient of 0.640 between gender and chocolate preference, he concludes there’s a strong, positive linear relationship between the two. What’s wrong with this analysis?


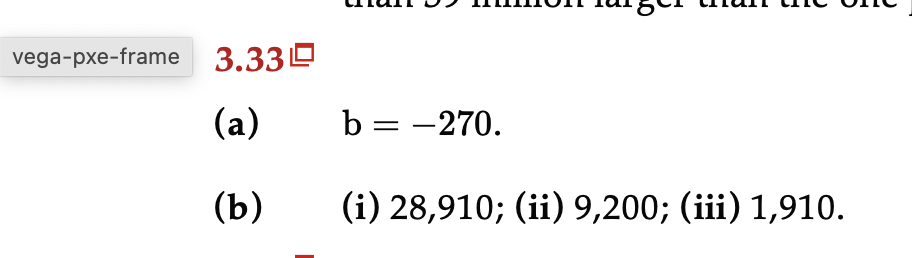

Mountain bike information (move on to next problem)

3.43 [TRY] [APP] Mountain bike and suspension type Refer to the previous exercise. In addition to weight and price, the data file also contains information on the type of suspension of the bike .
The following scatterplot, obtained via the Multivariate Relationships app, colors the dots by suspension type. Is the single regression line fitted in the previous exercise the best way to describe the relationship between weight and price?
Using the app or other software, find separate regression equations for the two suspension types. Summarize your findings.
The correlation coefficient for all 12 data points is If the correlation coefficients for the full and front-end suspension bikes are found separately, how do you believe they will compare to ? Find them and interpret. (Hint: The Multivariate Relationships app allows you to find r and for each suspension type separately.)
You see a mountain bike advertised for $700 that weighs 28.5 lb. The type of suspension is not given. Would you predict that this bike has a full or a front-end suspension? Statistically justify your answer.
