Epidemiology and Data Presentation
 Call Kai
 Learn
Learn Practice Test
 Spaced Repetition
 Match
Match Flashcards
 Knowt Play
1/64

There's no tags or description
Looks like no tags are added yet.
Name | Mastery | Learn | Test | Matching | Spaced | Call with Kai | Chat |
|---|
No analytics yet
Send a link to your students to track their progress
65 Terms
Population
Measurable quantity = parameter
Complete set
Contain all members of this group
Reports are a true representation
Sample
Measurable quality = statistic
Incomplete set
A subset of the entire population
Reports have a margin of error and a confidence interval
All inhabitants of the state of Texas
Population
30 students from the school of public health
Sample
The TAMU undergrad student body
(Depends on context —> TAMU undergrad student body)
All cancer patients in the US
population
1500 pre-diabetic adolescents from the Houston metropolitan area
sample
Inferential statistics use sample-based data to make conclusions about the population from which a sample has been selected – a process known as ___
estimation

The sample mean is used as an
estimate of the population mean (a parameter).
Probability sampling (random sampling)
Every member of the population has a known probability of being sampled
Uses statistics; thus, we measure sampling error
Non-Probability sampling (non-random sampling)
inherently biased
cannot measure sampling error
Probability Sampling Designs: Simple Random Sampling (SRS)
Gives every member of the population an equal chance of being included in the sample
Simple, often unrealistic, expensive, logistical difficulties
Poorly distributed variables = over or under-estimation
Basis of effective sampling techniques
Example: random number generator, random digit dialing, draw names from a hot
Random sampling is ___
unbiased
Probability Sampling Designs: Stratified Sampling
Target population is divided into suitable, nonoverlapping homogeneous sub-populations or strata
A random sample is selected within each stratum to represent all strata and reduce sampling error accurately
Offers a way to have representation from all subgroups

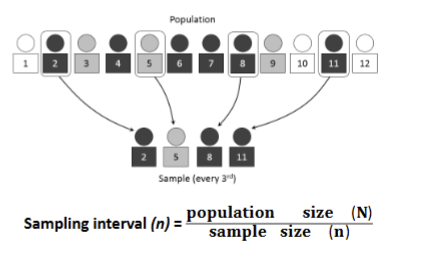
Probability Sampling Designs: Systematic sampling
Used when individuals or households can be ordered
Determines a sampling interval (n), by dividing the total population by the sample size
Choosing a random starting point on the list, select every nth person
Useful if the population is listed by geographic area or another stratifying characteristic
Easy and popular method
Probability Sampling Designs: Cluster sampling
useful in saving resources in surveys of human populations when:
The population is geographically dispersed
Sampling frame for the elements of the population studied is not available
The units first sampled are not individual elements we are examining, but clusters or aggregates of those elements, can be space-based (State, county, block), organizational (school, grades), telephone based (area code)

Non-Probability Sampling Designs: Convenience sampling
Using a sample that is near at hand
People out and about, on a road, engaged in a specific activity at the time of the survey
Street-corner political surveys, sampling at a clinic, internet/media-based polling
Prone to sampling bias
Individuals who have been selected may not be representative of the population
Often used to explore ideas and opinions of people about a new topic that may not be ready for a quantitative investigation
Qualitative Data
do not have numerical value or rankings
Quantitative data
reported as a numerical quantity
Nominal data
Unordered
Dichotomous/Binary

Ordinal data
Can be ordered

Discrete data
finite number

Continuous Data
infinite number

Steven’s measurement scales: Nominal
Not ordered
Qualitative
Determine equality
Number of cases
Steven’s measurement scales: Ordinal
Ordered/ranked
Qualitative
Determines greater/less
Median percentiles
Steven’s measurement scales: Interval
Continuous
Equal intervals between points
No true zero scale
Determines equality of intervals
Mean, standard deviation, correlation
Steven’s measurement scales: Ratio
Continuous
No True zero scale
Determination of equality of ratios
Coefficient of variation
Nusrat stood outside of the MSC and selected 25 students to participate in a survey is an example of,
Convenience sampling
A survey was distributed to all students who live on the 3rd floor of Clements Residence Hall
Cluster sampling
A random sample of 50 SPH (25 undergraduate and 25 graduate) are selected to participate in a study
Stratified sampling
A random number generator was used to sample 100 students in the TAMU student population to participate in a study
Simple random sampling
The entire SPH student body was ordered by their GPA and every 20th student was invited to participate in a study
Systematic sampling
For a random sample, when the sample mean differs from the population mean, this difference is most likely a reflection of”
Random error that affected the sample
Bar charts
Useful for displaying discrete variables

Histogram
Display the frequency of distributions for grouped/ordered categories of a continuous variable

Line graph
Track trends over time
Use different lines to show difference between subgroups

Pie chart
Useful for showing the proportions of cases according to several different categories

Mode
Number that occurs most frequently
Median
when numbers are ordered, the middle (dividing the lower and upper half)
Mean
arithmetic average
Range
H - L
Difference between highest and lowest
Half range
Arithmetic mean of (H) and (L)

Mean deviation
Average of absolute values of the deviations of each observation about the mean

Variance
Degree of variability

Standard deviation
Square root of the variance

Distribution

Distribution curves
Graph the frequencies of the values of a variable
The mode of a distribution curve is the most frequently occurring value (peak)
Can have multiple modes (peaks)
Different distributions may exhibit different degrees of spread
Distribution curves: Normal— Math aspect

Distribution curves: Normal
Each curve has the same mean/median/mode, but they have different dispersions

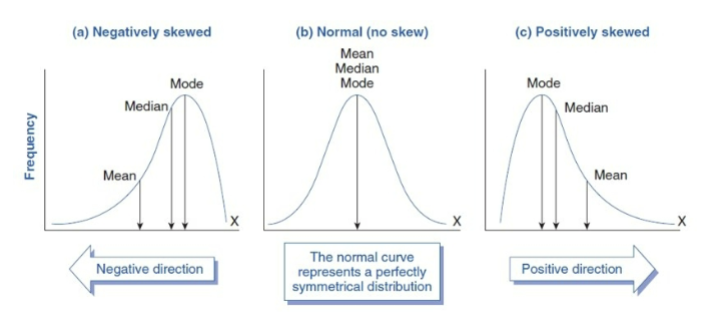
Distribution curves: Skewness
Distribution curves: Multimodal distribution
have multiple modes (peaks) in the frequency of a condition
Reasons a curve could be multimodal
Age-related changes in immune status of lifestyle of the host
Chronic diseases with long latency periods

Distribution curves: Epidemic curves
Graphic plotting of the distribution of cases by time on onset
Unimodal curve
Helps identify the cause and peak of a disease outbreak

Bivariate association
Examines the relationship between two variables
An association between two variables signifies only that they are related and not that the association is causal
CORRELATION DOESNT EQUAL CAUSATION

Bivariate associations: Pearson Correlation Coefficient (r )
Measures the strength of an association
Range from -1 to +1
If r is negative: inverse relationship
If r is positive: positive relationship
If r is closer to +1 or -1:
If r approaches 0: the association becomes weaker
If r = 0: there is no association
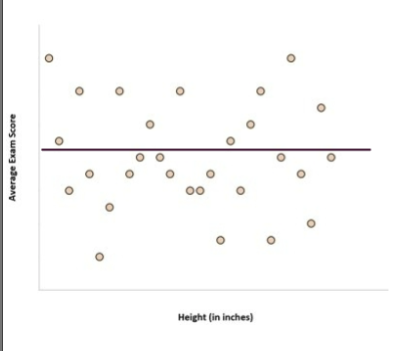
There is no associated between height and exam scores
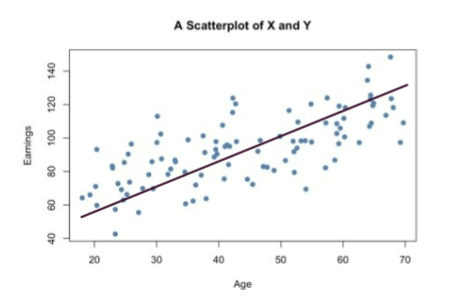
Higher age is associated with higher earnings
POSITIVE relationship
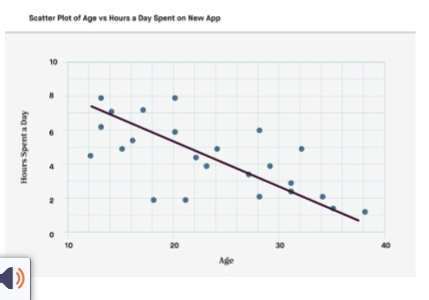
Higher age is associated with less time spent on the app
NEGATIVE relationship
Scatter Plots and Pearson’s R

Non-linear correlations
Linear correlation between X and Y is essentially 0 (-0.09)
There is no linear association, but this does not imply there is no relationship between the 2 variables. It is just non-linear

Dose Response Curves
Graphs the correlative association between an exposure and effect
Dose = X axis
Response = Y axis
Beginning flat portion = subthreshold phase (low dose, no/minimal effect)
Steep incline = Threshold reached (increasing dose —> increasing effect
Flattens at top = maximal response reached

Contingency Tables
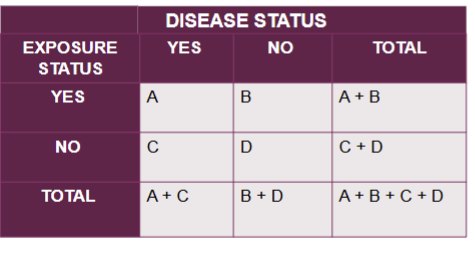
A = Exposure is present, and disease is present
B = Exposure is present, and disease is absent
C = Exposure is absent, and disease is present
D = Exposure is absent, and disease is absent
Parameter estimates
Point estimate = Single value used to estimate a parameter (using sample mean to estimate the population mean)
Interval estimate = Range of values that with a certain level of confidence contains the parameter
95% confidence level (most common): one is 95% certain that the confidence interval contains the parameter
For a more precise/narrower estimate of the confidence interval, one should increase the sample size (n)
Example of nominal variable
Blood type
Which variable type is best suited for ranking preferences (strongly agree, agree, neutral, disagree)
Ordinal
What type of variable would “height” be classified as?
Continuous