[27] Images: Radiation & Energy Flux
 Call Kai
 Learn
 Practice Test
 Spaced Repetition
 Match
 Flashcards
 Knowt Play
1/44

There's no tags or description
Looks like no tags are added yet.
45 Terms

Img R001: Which instrument made this map and what is shown?
CERES (Clouds and the Earth's Radiant Energy System, flown on Terra, Aqua, Suomi NPP and NOAA-20): top-of-atmosphere reflected shortwave (solar) radiation in W/m2, a measure of Earth's albedo.

Img R002: Why are the clear subtropical oceans the darkest regions on this map?
Open ocean has very low albedo (about 0.06) and few clouds under subtropical highs, so little sunlight is reflected.
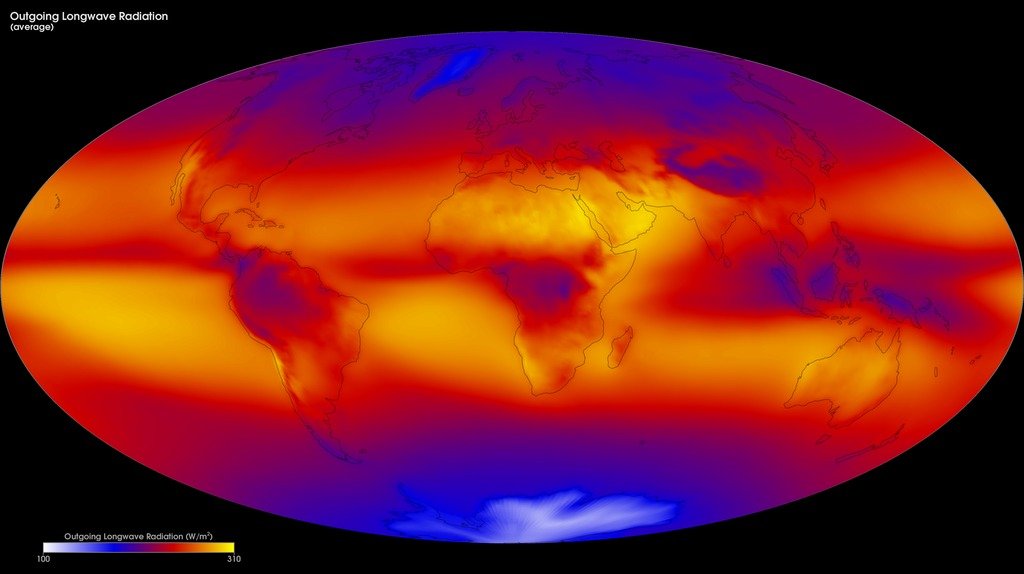
Img R003: Which CERES product is this, and why is OLR low over the Amazon and Indonesia even though the surface is hot?
Outgoing longwave radiation (W/m2). Deep convective clouds there have very cold tops high in the troposphere, so they emit less longwave to space.

Img R004: Why is OLR highest over the Sahara and subtropical oceans?
Clear skies and warm surfaces: radiation escapes from a warm, low emitting level (sigma T^4 large).

Img R005: Look-alike check: on the reflected SW map the ITCZ is bright. On this map it is dark. Explain.
Tall tropical clouds reflect much sunlight (high SW) and emit from cold tops (low OLR). Their SW cooling and LW warming partly cancel.

Img R006: What does this CERES map show, and why are the tropics positive and the poles negative?
TOA net radiation (incoming solar absorbed minus outgoing longwave). Tropics absorb more sunlight than they emit (surplus). High latitudes emit more than they absorb (deficit). Winds and ocean currents carry the excess heat poleward.

Img R007: Why is the Sahara a net-radiation deficit region despite strong sunshine?
Its bright sand reflects much sunlight, its clear dry air lets lots of longwave escape from a hot surface, and few clouds trap it.

Img R008: Using this CERES budget, compute Earth's planetary albedo.
Reflected / incoming = 99 / 340 = about 0.29.

Img R009: Why is incoming solar 340 W/m2 rather than the solar constant of about 1361 W/m2?
Earth intercepts sunlight over its cross-section (pi R^2) but spreads it over its whole surface (4 pi R^2), so the global average is S/4 = about 340 W/m2.

Img R010: What is the TOA imbalance in this budget, and what does a positive value mean?
About +0.71 W/m2 (2005 to 2015). Earth absorbs more energy than it emits, so the climate system (mainly the ocean) is accumulating heat.

Img R011: In the NASA energy budget, which is larger at the surface: absorbed sunlight or back radiation from the atmosphere?
Back radiation (about 340 W/m2) is about twice the absorbed sunlight (about 163 W/m2), which is the greenhouse effect.

Img R012: What is the 'atmospheric window' (about 40 W/m2)?
Surface longwave emission at about 8 to 13 um that passes through the atmosphere to space with little absorption (between the main H2O and CO2 absorption bands, although ozone absorbs near 9.6 um).

Img R013: How do you get the effective radiating temperature of Earth from OLR = 240 W/m2?
Stefan-Boltzmann: T = (OLR / sigma)^(1/4) = (240 / 5.67e-8)^(1/4) = about 255 K (-18 C), about 33 K colder than the 288 K mean surface temperature.

Img R014: What does a band of low OLR in the tropics indicate on a monthly CERES map?
Persistent deep convection (tall, cold-topped clouds), i.e. heavy rainfall regions such as the ITCZ, Amazon, Congo and Maritime Continent.

Img R015: What two independent datasets are compared in this plot, and what did the study conclude?
CERES net TOA radiation and in situ planetary heat uptake (mostly ocean, Argo). Both show Earth's energy imbalance roughly doubled from about 0.5 to about 1 W/m2 between 2005 and 2019.

Img R016: Using the study's values (about 0.5 W/m2 in 2005 and about 1.0 W/m2 in 2019), estimate the rate of change per decade.
0.5 W/m2 over 14 years = about 0.036 W/m2 per year = about 0.36 W/m2 per decade (the imbalance roughly doubled).

Img R017: How is cumulative heat uptake related to the energy imbalance?
Cumulative heat = imbalance (W/m2) x Earth's surface area (5.1 x 10^14 m2) x time. A constant 0.7 W/m2 for one year gives about 1.1 x 10^22 J.

Img R018: Why does the monthly curve oscillate every year?
Seasonal cycle of the global energy budget (Earth-Sun distance, perihelion in January, and hemispheric land/ocean differences).

Img R019: Why is the x axis sin(latitude) instead of latitude?
Equal intervals of sin(latitude) cover equal surface areas, so the areas under the curve compare fairly (positive and negative balance).

Img R020: At about what latitude does net TOA radiation change sign, and what follows from the pattern?
About 35 degrees (sin(lat) about 0.55 to 0.6). Energy surplus in the tropics and deficit poleward of that must be balanced by poleward heat transport (winds, storms, ocean currents).

Img R021: On average, do clouds warm or cool the Earth according to CERES, and by about how much?
They cool it: global net cloud radiative effect is roughly -18 to -20 W/m2 (SW cooling about -46, LW warming about +27).

Img R022: Why is the net cloud radiative effect positive (warming) over Antarctica and the Sahara?
These surfaces are already bright (high albedo), so clouds add little extra reflection, while they still trap outgoing longwave radiation.

Img R023: Why is the shortwave cloud radiative effect negative?
Clouds have a higher albedo than most of the surface beneath them, so they increase reflected sunlight and reduce absorbed solar energy (a cooling effect).

Img R024: Which clouds have the largest longwave (warming) cloud radiative effect and why?
High, cold-topped clouds (deep convection, cirrus): they emit at very low temperatures, so OLR is reduced most compared with clear sky.

Img R025: Why can a monthly reflected-SW map show low values over bright snow, e.g. high Arctic in winter?
Reflected SW = albedo x incoming sunlight. With little or no sunlight (polar night/low sun), even a high-albedo surface reflects few W/m2.

Img R026: What does the increasing slope of this CERES cumulative heat curve tell you?
The rate of heat gain (energy imbalance) is increasing over time. Slope (J per year) / (Earth area x seconds per year) gives the imbalance in W/m2.

Img R027: Is this curve better described as linear, piecewise-linear, or exponential?
Upward-curving (accelerating): roughly piecewise-linear with a steeper slope after about 2010, or a quadratic/exponential-like increase, rather than a single straight line.

Img R028: Which variable and instrument? Explain the low (cyan) values over India and SE Asia in July.
CERES TOA outgoing longwave (all-sky, monthly). Summer monsoon deep convection: tall cold cloud tops reduce OLR.

Img R029: Why is OLR lowest over Antarctica in July?
Antarctic winter: the surface and atmosphere are extremely cold, so sigma T^4 emission is small.

Img R030: This map uses the same rainbow palette as the CERES OLR map. How do you know it is reflected shortwave?
Antarctica is zero (no sunlight in July polar night) while sunlit Greenland/Arctic ice is high. OLR would instead be lowest at cold poles regardless of sunlight and highest over hot deserts.

Img R031: In this July CERES net-flux map, why is most of the Southern Hemisphere strongly negative?
It is SH winter: little incoming sunlight but continued longwave emission, so net radiation is a large deficit. The NH summer hemisphere has a surplus.

Img R032: Comparing January and July CERES reflected-SW maps, which features flip between hemispheres and why?
High values over the summer pole (Antarctica in January, Greenland/Arctic in July) and zero over the winter pole: sunlight only reaches the summer polar region.

Img R033: During the strong 2015 to 2016 El Nino, where would you expect anomalously low OLR in the tropical Pacific?
Central and eastern equatorial Pacific, where warm SSTs shift deep convection eastward from the usual West Pacific warm pool.

Img R034: Why does this map show only east-west bands with no continents or clouds visible?
It is incoming solar radiation at the top of the atmosphere, set by latitude, season and Earth-Sun distance only, before any interaction with clouds or the surface.

Img R035: In July, why is the daily-mean insolation near the North Pole as high as or higher than at the equator?
24 hours of daylight at the summer pole outweigh the lower sun angle.

Img R036: Compare clear-sky OLR (this map) with all-sky OLR (075). Why does the clear-sky map lack low values over the Asian monsoon and Amazon?
Clear-sky fluxes exclude clouds. The low all-sky OLR there comes from cold high cloud tops. The difference (clear minus all-sky OLR) is the longwave cloud radiative effect.
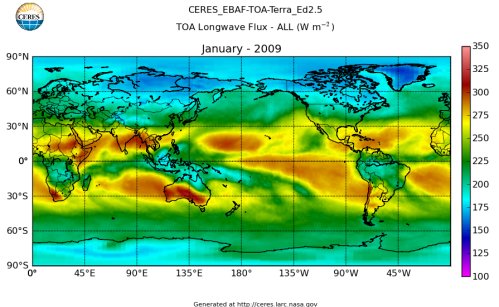
Img R037: Which instrument made this map of top-of-atmosphere longwave flux in W/m2?
CERES (here the EBAF product, from Terra).

Img R038: On a CERES outgoing longwave map, why are both Antarctica and the Indonesian warm pool low?
Antarctica is a cold surface. Over Indonesia, deep convection makes high, cold cloud tops that emit little longwave.

Img R039: Name regions with high OLR (>275 W/m2) in January.
Sahara, Arabian Peninsula, Australian outback, clear subtropical oceans: warm and cloud-free.

Img R040: A CERES map titled 'Clear-sky Outgoing ___ DJF': what is the missing word, and what does DJF mean?
Longwave radiation (OLR). DJF = December, January, February (Southern Hemisphere summer).

Img R041: Western Australia shows 300 W/m2 clear-sky OLR. With emissivity 0.95, what is its effective temperature?
T = (300/(0.95 x 5.67e-8))^(1/4), about 273 K.

Img R042: Is clear-sky OLR minus all-sky OLR over the tropics positive or negative, and what is it called?
Positive. It is the longwave cloud radiative effect (cloud forcing): high, cold cloud tops emit less than the surface would (Stefan-Boltzmann).

Img R043: What instrument made this 10-year mean map, what does OLR stand for, and what are its units?
CERES. Outgoing Longwave Radiation. W/m2.

Img R044: Why is OLR low over the equatorial convection regions (Indonesia, Amazon, Congo)?
Strong solar heating drives the ITCZ/Hadley cell rising branch, forming tall deep clouds whose cold tops emit little longwave radiation to space.
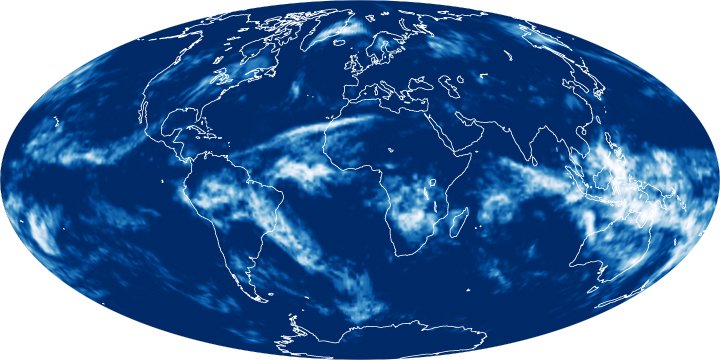
Img R045: What does CERES stand for, what does it measure, and which satellites carry it?
Clouds and the Earth's Radiant Energy System. It measures Earth's radiation budget (reflected shortwave, emitted longwave, net) and supports cloud property estimates. On Terra, Aqua, Suomi NPP (and NOAA-20