EAB exam 2 theories
 Call Kai
 Learn
 Practice Test
 Spaced Repetition
 Match
 Flashcards
 Knowt Play
1/94

There's no tags or description
Looks like no tags are added yet.
95 Terms
optimality theory
-individuals filter through candidate options to find which behavior maximizes the benefit (increase fitness) and minimizes the cost
-behavior is usually independent of what others are doing
-can quantify why one behavior (phenotype) is more likely to be selected by natural selection over others
mobbing, shared vigilance, sentinel vigilance
active social behaviors
dilution effect hypothesis, confusion effect hypothesis, selfish herd hypothesis
passive social behaviors
predator distraction hypothesis
mobbing potential predators distracts them from depredating nests
many eyes hypothesis
associating in groups makes it more likely that predators will be detected by at least one group member
selfish, state-dependent hypothesis
sentinel duty depends on an individual's current energetic reserves (if you're full, you're sentinel)
kin-selection hypothesis
sentinels incur personal risks to improve the survival of relatives, directly boosting sentinel's indirect fitness
dilution effect hypothesis
passive social behavior -- associating in groups makes it less likely that any one individual will be depredated
benefit: decrease chance you are predated upon; increased mating opportunities
cost: conspicuous mass (attract attention); less nutrients since you have to share

confusion effect hypothesis
passive social behavior -- moving as a group may reduce the likelihood of predators capturing prey because of their inability to single out and attack an individual

selfish herd hypothesis
passive social behavior -- individuals in a group attempt to reduce predation risk by putting other individuals between themselves and the predator
benefit: reduce chance of being caught
cost: higher conspicuousness
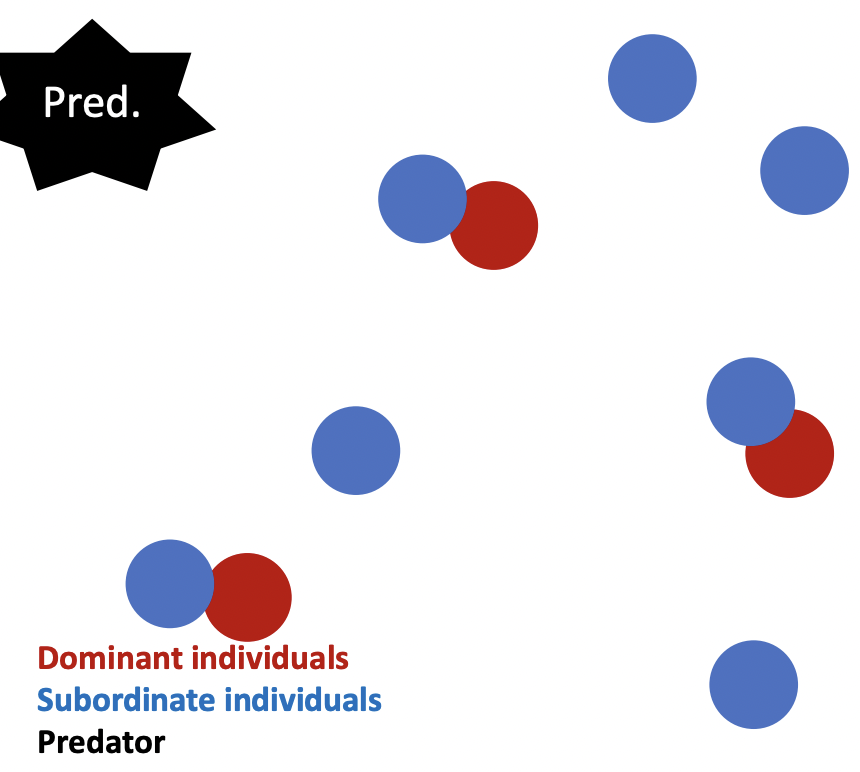
if the costs are consistently outweighed by the benefit, the dominant mutation could spread through the population over time
cryptic coloration
pigmentation adaptations that prevent detection by an observer
benefit: reduce chances of being predated
cost: time and energy expended in finding the right background and/or time spent being immoible (if they move, they are seen)
background matching
cryptic coloration -- replicating ambient hue, lightness, and geometry; minimizes the prey's signal-to-noise ratio against substrates

disruptive coloration
cryptic coloration -- high-contrast patterns placed across body edges; breaks up recognizable body outlines and surface boundaries

masquerade
cryptic coloration -- morphological resemblance to inedible objects; prevents cognitive recognition rather than sensory detection

countershading
cryptic coloration -- dark dorsal and light ventral grading; cancels shadows caused by overhead lighting

aposematic coloration
pigmentation adaptations that use conspicuous warning colorations to signal to predators that this organism is unpalatable or noxious
benefit: reduced predation rate over time as predators learn to associate coloration with toxin
cost: conspicuous coloration draws attention if predator is unaware of noxiousness
batesian mimicry
non-noxious species deceive predators by mimicking noxious species
benefit: predators avoid you
cost: conspicuous coloration on an animal that isn't noxious
mullerian mimicry
two or more unpalatable, toxic, or dangerous species evolve to share similar warning signals; honest signaling
benefit: fewer individuals are sacrificed per capita to train naive predators
cost: highly toxic species suffer if paired with a weakly toxic co-mimic
signal deception hypothesis
when a prey's appearance or behavior activates escape behavior on the part of the predator
benefit: can successfully divert adversarial attacks
cost: sacrificing evasion for deception is risky
alarm signal hypothesis
the individual performs the behavior to communicate predation risk to conspecifics
confusion effect hypothesis
if several individuals perform the behavior simultaneously in a group while fleeing, then the predator may become confused

social cohesion hypothesis
individuals perform the behavior to attract conspecifics to join them
attack deterrence hypothesis
individuals perform the behavior to signal their "vigor" and energy level to potential predators
anti-ambush hypothesis
individuals perform the behavior when they see one predator to look for other predators that may be lying in wait
mobbing
active social behavior -- individuals of a population harass/deter potential predators by acoustic warnings, physical intimidation, recruitment calls
costs: energy exertion, eavesdropping predators
game theory
-behavior depends on what others are doing
-mathematical tool
-emphasizes the dynamics of behavioral interactions between different individuals or species
-can be used to predict how an individual should behave in a given context
game theory
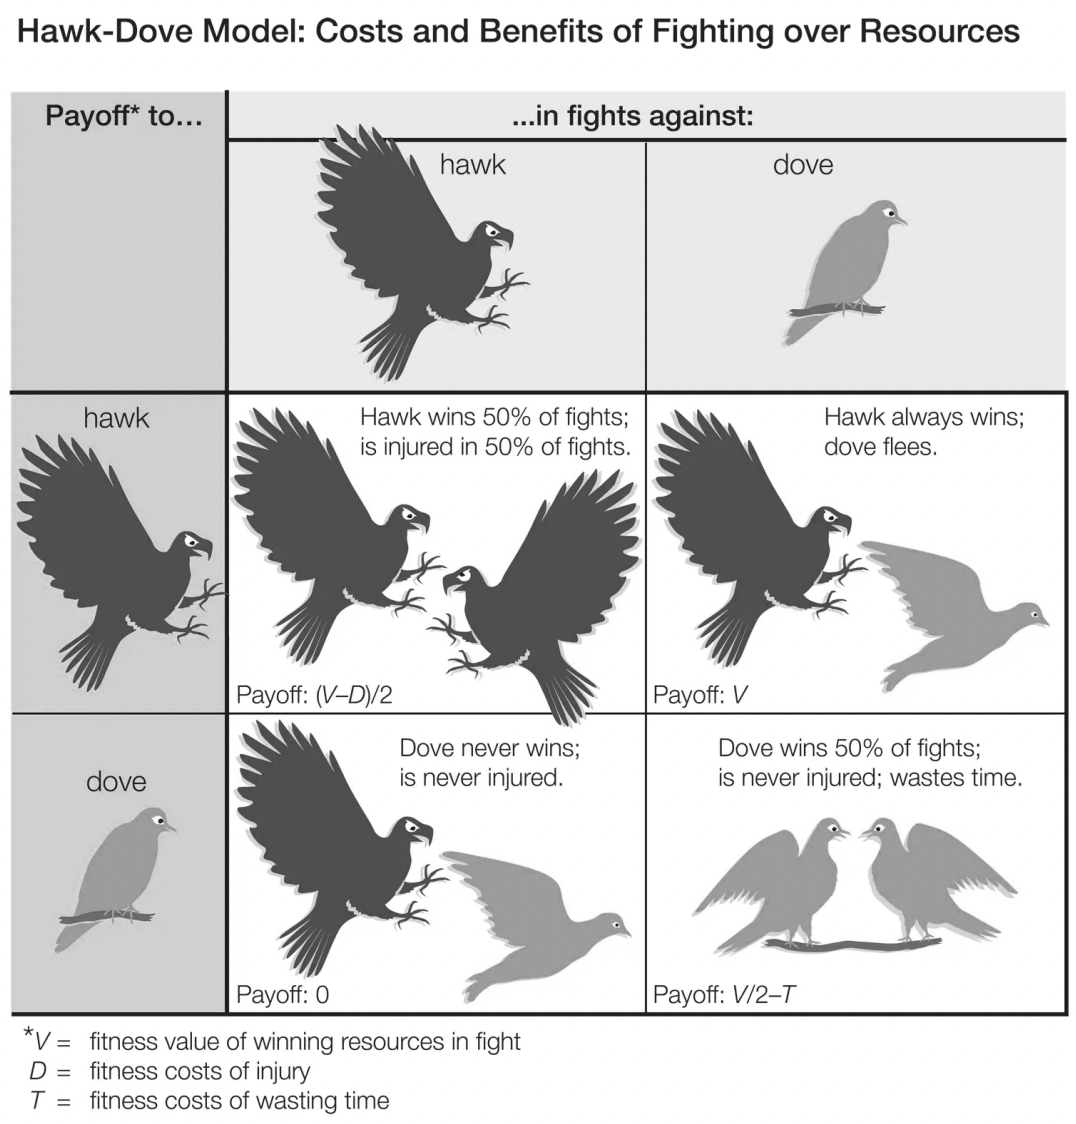
example: hawk and dove game
hawk: aggressive behavior
dove: nonaggressive behavior
possible outcomes:
1. hawk vs. hawk: both fight, risk injury
2. hawk vs. dove: hawk wins, dove retreats
3. dove vs. dove: neither escalates the fight, share a chance of obtaining resources
shared vigilance
active social behavior -- occurs when multiple individuals within a social group contribute to scanning their surroundings; because the job is shared, individuals can lower their personal guard without increasing their risk of being caught
costs: reduces feeding time and efficiency
sentinel vigilance
active social behavior -- mostly specific to cooperative species that live in kin-based social groups; single individual will serve as "sentinel" or "lookout" while others graze/eat
costs: severe environmental constraints (like drought) can depress sentinel contributions, because individuals will prioritize feeding
standing out
-aposematic coloration
-mimicry
-signal deception
-anti-ambush
-social cohesion
-confusion effect
-attack deterrence
confusion effect hypothesis
to test: Hogan et al. (2016)
-demonstrated it with a 3D computer simulation
-predators have difficulty focusing on one individual when many animals move together
cryptic coloration
to test: Pietrewicz and Kamil (1977)
-used birds searching for camouflaged prey against different backgrounds
-camouflaged prey were harder to detect when they blended into their surroundings
cryptic coloration
to test: Bond and Kamil (1999)
-birds searched for prey against backgrounds of varying difficulty
-more difficult backgrounds generally increased the time needed to locate prey and reduced detection accuracy
asposmatic coloration
to test: Brower (1958) and Brower & Calver (1985)
-found that after a blue jay vomits one poisonous monarch, it avoids the species thereafter
aposematic coloration
to test: Stankowish et al. (2011)
-comparative analysis
-showed boldly colored, dichromatic mammals tend to use anal gland secretions for defense
batesian mimicry
to test: Rabosky et al. (2016)
-examined evolution of coral snake-like color patterns in harmless snakes
-argued that harmless snakes benefited from this because predators avoid coral-snake-like color patterns
mullerian mimicry
to test: Stuckert et al. (2014)
-tested if it was truly beneficial to have similar warning colors for different species
-exposed naive chicken to colorful poisonous frog species
-found that naive chickens exposed to either of the two colorful poisonous frogs quickly learned to avoid them both
signal deception hypothesis
to test: Greene et al. (1987)
-compared normal flies with flies whose wings were experimentally exchanged or reattached
-results supported the idea that tephritid fly wing patterns help trigger defensive or escape responses in jumping spiders
-strongly supported this hypothesis
attack deterrence hypothesis
which hypothesis did the thomas gazelle stotting hypotheical support?
granivores
animals that eat seeds, nuts, berries
herbivores
animals that eat plants
carnivores
animals that eat living animals
scavengers
animals that eat dead animals
hippo butt leech
-leeches specialize on hippo blood
-live in rectum (thin tissue, safe from predators, optimal temperature and moisture levels for the leech)
cane toad
-invasive species that is highly toxic
-people run them over with their cars
-birds learned they can eat the non-toxic tongues of the dead ones
ants
~50 mya they began cultivating their own food via mutualistic relationship with fungi
-promote the growth of fungi (good for fungus)
-eat the vegetative shoots produced by fungi (good for ants)
-fungus digests leaf material, promoting fungal growth
-fungus produces densely packed hyphal clumps called gonglyidia
gongylidia
densely packed hyphal clumps that fungus produces for ants to farm and eat

cameron currie
found that ants not only cultivate their farms but also work with a bacteria strain to fertilize their fungal farms
evidence:
1. all species of fungus-growing ants had Streptomyces bacteria with them that produced antibiotics
2. ants transmit bacteria across generations
3. only females possess the bacteria (makes sense, females cultivate the gardens)
4. bacteria found only wipe out parasites that are only dangerous to the fungus
timbergen
hypothesized animals form a search image over time
search image
-animals encounter a prey type more and more, forming an image representation in their mind that becomes more detailed w/ experience
-evidence for support: in Bobwhite Quail, the probability of detecting prey increases with each successful prey capture (Gendron 1986)
feature-based attention hypothesis
forageers are keying on one or two salient attributes of the prey (color, movement, pattern) to form a search image
holistic representation hypothesis
search image formed is closer to some sort of representation of the entire prey item
optimal foraging theory
-specific application of the more general "optimality theory"
-a class of mathematical models that predict how animals maximize fitness while foraging

optimal foraging models
an animal's feeding behavior should provide max energy gain with minimal energy cost and minimal risk of dying
assumptions
-made with behaviorists build optimal foraging models (OFT)
-conditions the model is assuming to be true
-if violated, the results can be biased or misleading
examples:
-heritability
-fitness is tied to energy intake
-prefect information (omniscience)
-no competition
-food encounters are random (not clustered)
optimal diet models
what food items should a forager eat?
optimal patch residence models
how long should a forager stay in a certain patch of food?
risk-sensitive models
how does variance in food supply affect the forager's decision about what food type to eat?
patch
a region of heterogeneous environment where a forager may decide to spend time searching for food before moving on to the next patch (ex: a flower full of nectar, a tree with fruits on it, etc.)
marginal value theorem
predicts an animal should leave a patch when the energy intake rate within the patch diminishes to the average energy-harvesting rate in the environment
optimal patch residence models
the optimal time to stay in a patch is a function of travel time between patches
optimal patch residence models
the rate of energy for a forager per unit of time, across the entire environment (not just a single patch) is described as:
rate_average = energy gained in patches / (time spent foraging + time spent traveling)
marginal value theorem
predicts:
1. calorie gain rate of staying in a patch decreases as patch is depleted (demonstrated with the blue gain curve)
2. forager should stay until they can do better elsewhere (includes travel costs)
3. forager should leave:
-when expected gain from current patch < expected gain of new patch
-at the point that gives the greatest gain or food intake per unit time
-demonstrated with the black dashed lines and dots)
4. the greater the distance between patches, the longer the animal should stay

optimal patch residence models
to test: Cowie (1977)
-investigates how travel time affects how long birds stay in food patches
-cups of mealworms hidden in sawdust placed around the perches
-some cups had lids that were easy to dislodge (short travel time)
-some cups had lids that were difficult to dislodge (long travel time)
-as "travel time" increased, time is each "patch" increased
risk
-increased variance in prey availability
-increases the odds that an animal will find very little amounts of prey, AND the odds it will find a lot of prey
risk-sensitive model
example hunger state 1:
-forager is starving
-each additional food item it eats is worth more and more (to a point)
example hunger state 2:
-forager values every new food item equally
-whether on 1st or 15th item, each provides the same value
example hunger state 3:
-forager is satiated
-although every additional food item has value, it's worth less and less
starving
value function/graph: convex
risk preference: risk-prone
patch choice: risky 16-or-0 patch

intermediate
value function/graph: linear
risk preference: indifferent
patch choice: either

fully satiated
value function/graph: concave
risk preference: risk-adverse
patch choice: safe 8-for-sure patch

risk-sensitive model
example: yellow-eyed juncos
-offered choice between 2 feeding sites:
1. one consistent (5 mealworms)
2. one variable (0 or 10 mealworms, but mean of 5)
-1 hour starvation --> chose consistent food source
-4 hour starvation --> chose variable food source (risk prone)
habit choice
-not necessarily a conscious choice
-animals repond to key aspects of their environment:
--> shelter (avoid predation)
--> food availability
--> mate availability
--> environmental conditions
home range
animals restrict paths to familiar geographic boundaries to sustain energetic and physiological demands

habitat choice
how animals distribute themselves in space and time with respect to some resources in their environment
nomadic
irregular, far ranging pattern of space use lacking fixed seasonal return paths or spatial predictability

migratory
regular, predictable, and directional seasonal movement of individuals between geographically distinct regions

minimum convex polygon (MCP)
a geometric method that delineates an animal's home range by constructing the smallest convex perimeter around coordinates
ideal free distribution (IFD) model
to minimize resource competition, a population may distribute itself across multiple resources so that it is evenly distributed
-assumes no cost to moving between patches
-assumes animals can tell which habitats have more resources
-model predicts first individuals to arrive should settle in habitat with most resources
-predicts that when fitness returns of primary habitat become lower than secondary habitat, the animal should move to secondary

IFD equilibrium
individuals are distributed so that per capita fitness is equal across all patches

ideal free distribution model
-assumes complete knowledge of all resources in all habitats
-no cost/barrier to movement
-everyone competes equally
-an over-crowded rich patch becomes less profitable than an open poor patch
-forces a balance where every individual achieves the exact same fitness
ideal despotic distribution model
-accounts for social dominance and territoriality
-stronger or earlier-arriving animals block others out (despotic)
-fitness is not equal
-animals in inferior habitats suffer lower survival and grwoth rates

ideal despotic distribution model (IDD)
-a modified version of IDF model
-aggression/territoriality can make resource acquisition unequal among individuals
-habitat choice is constrained by territorial behaviors of already established individuals
-can lead to individuals being forced into sub-optimal patch before the equilibrium distribution point is met

natural selection
likely acts strongly on behaviors that minimize exposure to disease
1. avoidance of habitats that contain pathogens
2. avoidance of individuals that are already ill
territoriality
the occupation and defense of a particular area
benefits: territories provide owners with access to food, mates, safe shelter
costs: owners must defend their territory from intruders (time and energy costs)

optimum territory size
the size denoted by the maximum distance between cost and benefit curves
-costs increase as territory size (x-axis) increases

territory ownership
requires vigilance against:
1. predators
2. conspecfic intruders
satellite
an intruder that is tolerated by the owner
ideal free distribution model
to test: Milinski (1979)
-used captive stickleback fish
-placed two feeders on opposite sides of a tank
-one feeder released 5 times more food (Daphnia) than the other = 5 times more fish
-fish distributed themselves in a 5:1 ratio, matching the food distribution
ideal free distribution model
to test: Harper (1982)
-two observers fed ducks from opposite sides of a pond
-treatment 1: both observers provided equal amounts of food
-treatment 2: one observer provided twice as much food
-equal food = ducks distributed 1:1
-twice as much food = ducks distributed 2:1
territory owners and satellites
to test: Davies & Houston (1981)
-studied pied wagtails defending riverside territories where they fed on insects
predictions:
-cost: satellites take some food from the territory
-benefit: satellites can help defend the territory against other intruders
-benefit: satellites may forage in areas the owner has already searched, reducing competition for remaining food
-owners should tolerate satellites when food is abundant and chase them away when food is scarce
all predictions supported
conditional cooperation
cooperation behaviors are contingent on the partner's contributions
byproduct mutualism
an individual performs a selfish action that incidentally yields fitness benefits to their partner
territory models
most assume animals know:
-how much food is in the area
-quality of the food
-how many predators
-how many conspecific competitors
conspecific cueing hypothesis
individuals use the choices of others to determine the quality of a potential territory
conspecific cueing hypothesis
to test: Stamps (2001)
-studied juvenile Anolis aeneus lizards
-juveniles observed two habitats of equal quality
-one habitat had a previous owner, while the other did not
-researchers removed the previous owner before allows juveniles to choose
results:
-juveniles consistently preferred habitats that previously had an owner
-when they had not observed a previous owner, they chose habitats randomly
-suggests visual component to conspecific cueing
optimal diet model
to test: krebs & krebs (1978)
-used great tits (birds)
-presented two different sizes of mealworms on a conveyor belt
-compared prey availability with the birds' actual food choices
-when highly profitable prey is encountered frequently, animals should become more selective and reject less profitable prey
