Machine Learning Exam #2
 Call Kai
 Learn
 Practice Test
 Spaced Repetition
 Match
 Flashcards
 Knowt Play
1/39

There's no tags or description
Looks like no tags are added yet.
40 Terms
Quadratic
One bend: a U or an ∩
B2 > 0: Upward, U
B2 < 0: Downward, ∩
Cubic
Two bends: an S
Polynomial Transformations
Changes the shape of the mean, correcting linearity, not heteroskedasticity
The relationship has multiple bends or turning points
Flexibility for complex shapes
Genuine optimum
X + I(X^2) + I(X^3)
Raw powers; correlated
Structural collinearity: individual raw coefficients and their p-values are not telling you much on their own, does not hurt fitted curve
Interpretation
poly(X, 3)
orthogonal polynomial basis; span the same base but are mutually uncorrelated
Adding a degree does not disturb the coefficients you already have
Prediction and comparing degrees
Turning point
X* = -B1/2B2
anova()
whether adding a polynomial degree improves the model
anova(m1, m2, m3)
Nested F-Test = p-value on orthagonal basis
Rule of Thumb: Data Amount
10 to 20 observations per estimated parameter
The honest answer depends on signal strength, noise level, how the predictor values are spread out, and what you want the model for.
Log Transformations
Monotonic: relationship curves once and keeps going
Percentage based interpretations
Data is right-skewed or heteroskedastic
Multiplicative relationship: elasticities, compound growth, diminishing returns
Inverse Property
log(ex) = x
elog(x) = x
Multiplication & Division Property
log(ab) = log(a) + log(b)
log(a/b) = log(a) - log(b)
Exponential Property
log(ab) = b*log(a)
Percentage Property
d log(x) = d x/x
Additive relationship
change by fixed amounts
Muliplicative relationships
change by percentages
Elasticity
log-log; 1% increase in X changes Y by β1%
Both variables right-skewed
Typical: exp(y)
Average: exp(y+se2/2)
Diminishing returns
log-X: a 1% increase in X changes Y by β1×0.01 units
X is right-skewed
Average: in units of y
Compound growth
log-Y: A one-unit increase in X changes Y by about β1×100%
Y is right-skewed
Typical: exp(y)
Average: exp(y+se2/2)
Diagnostic
Distribution: skewness
Linearity: curvature and funnel
Domain logic: theory on model
RMSE

MAE

exp(predict(model, newdata))
revenue of a typical observations (the median)
exp(predict(model, newdata) + sigma(model)^2 / 2)
average across observations
exp(predict(model, newdata, interval = "prediction"))
prediction interval; percentage spread rather than dollar spread
Formula: doubling X on log-log transformation
100*(2B1-1)
Classification
function f(X) that takes a feature vector X and predicts the value of a categorical response Y
Anomaly detection
Recommender system
Sentiment analysis
Why not linear regression for classification?
Predictions escape [0,1]
Variance is not constant
Standard errors are not trustworthy; too comfortability significant when there is no evidence
Odds
p/(1-p)
Logit: log(odds)
transforms odds from bounded at 0 to unbounded
Reciprocals are turned into the same number, negative
Log(Odds) > Probability
1 / 1 + e-(B0+B1X)
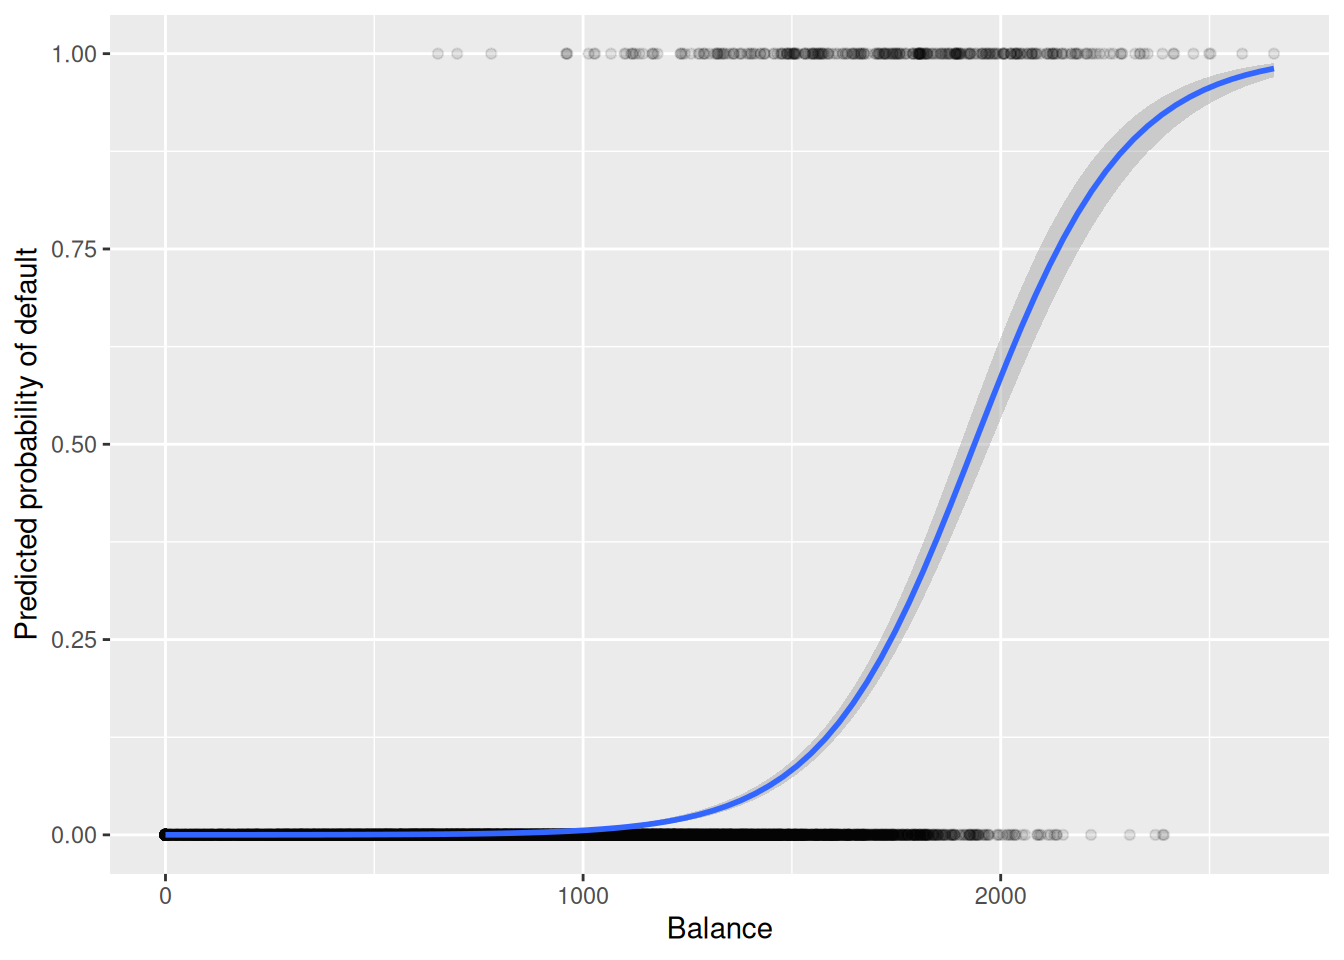
Sigmoid curve
For very low X, p approaches 0 but never arrives
For very high X, p approaches 1 but never arrives
Where β0+β1X=0, the log-odds are 0, the odds are 1, and the probability is exactly 0.5. That is the middle of the S-curve, the one balance at which default is a coin flip
Every output is a valid probability, always
Maximum likelihood estimation
search for the β0 and β1 that make the data we actually observed as likely as possible
createDataPartition()
separate imbalance data
Deviance
For every observation, the model assigned a probability to what actually happened. Deviance adds up, across all training rows, how surprised the model should be.
Confident and right is near zero, confident and wrong is huge.
Null Deviance
total for a model with no predictors, which gives every customer the same base rate, and can only be surprised by the “Yes”
Residual deviance
the total once predictors are in the model
Degrees of freedom
the number of training rows minus the number of parameters the model estimates
Akaike Information Criterion (AIC)
Roughly, AIC is deviance plus 2 for every parameter
Penalizes extra parameters, because deviance will always improve
Compare models that fit the same rows
Logistic Regression: Interpreting coefficients
B: log-odds scale
exp(B): odds ratio
Each additional unit multiples the odds of “Yes” by B
(exp(B)-1)*100: percentage
Each additional unit raises the odds of “Yes” by that percent
Effect of X units: eX*B
When adding variables, you are holding the other predictors constant
Accuracy
Accuracy assigns the same cost to every error and then averages across observations