Master List
 Call Kai
 Learn
 Practice Test
 Spaced Repetition
 Match
 Flashcards
 Knowt Play
1/294

There's no tags or description
Looks like no tags are added yet.
295 Terms
Task Board
visual depictions of work that needs to be done and what the status of the tasks are
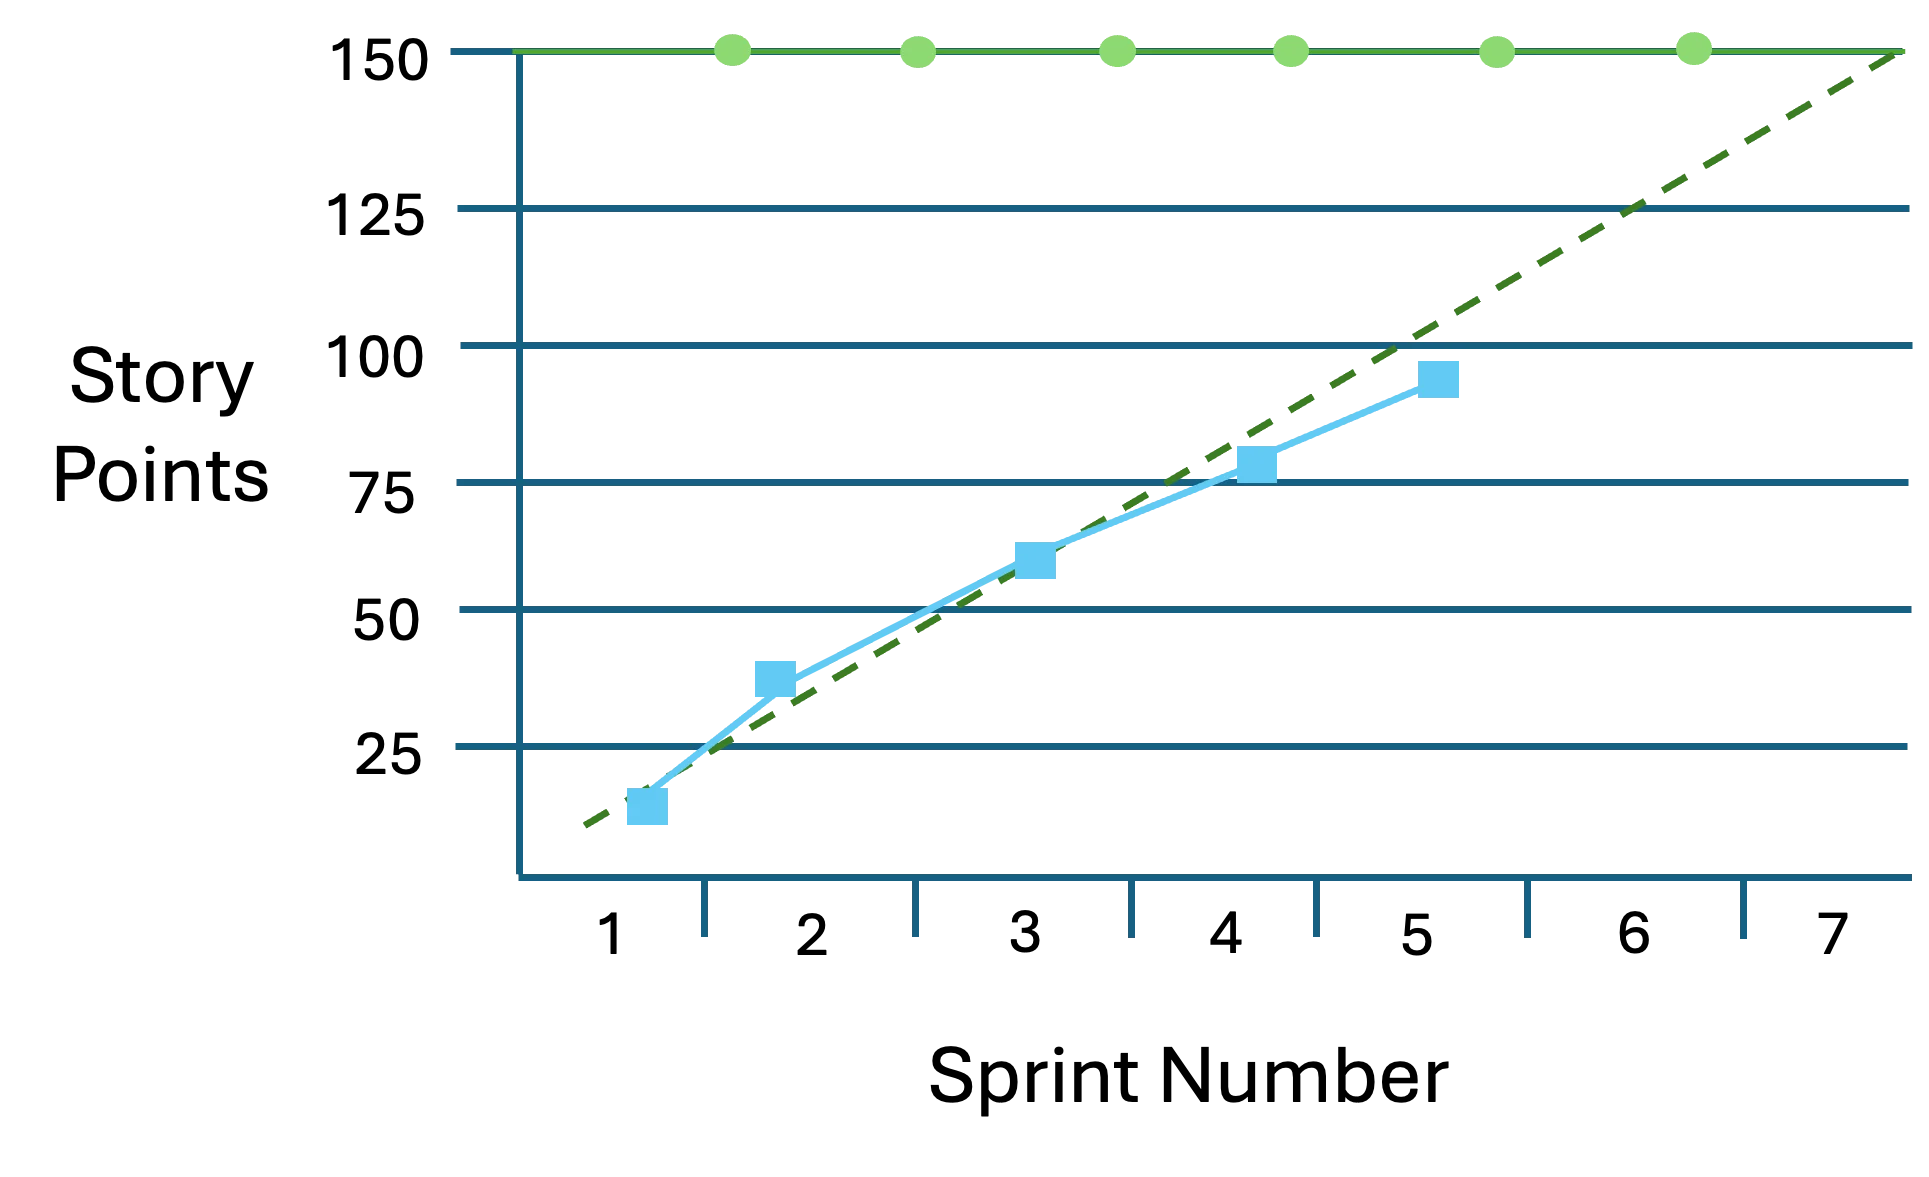
Burnup chart
shows the amount of work completed in the time period
a line indicates the target for completed work
works well with projects with a fixed scope and a flexible timeline
Milestone chart
Timeline charts that include timing, deadllines, check ins, and other critical dates for the project
provides enough detail to help people understand the project sequence but isnt so comprehensive that its hard to read
(EMV)
Expected Monetary Value
a way to calculate an average outcome in situations where there is uncertainty
to calculate this, we need to know the probability an event will occur and the impact of the event on the overall cost
The probability and its monetary impact are multiplied to reveal this
used to determine the contingency buffer needed for the project which is particularly helpful for large, expensive projects with many risks

Control Chart
statistical charts used to track the variation in a process over time
includes a center line, and upper control limit, and a lower control limit to identify when a process is out of control more quickly when used well
Issue log
tracks events that are occurring that are outside of the teams control
helps organize and prioritize the list of issues
focuses on the highest priority items as it may not be possible to address everything
Each issue is recorded with a description, the date found, and the person who found it
Five Whys
problem solving technique that involved asking “why” questinos to identify the root cause of a problem
Issue
something that is outside of the teams control
Defect
failure to meet the requirements
Whiteboard
most effective for creating visual representations, brainstorming, and collectively discussing solutions

(PDM)
Precedence Diagram Method
commonly used project diagram style that utilizes rectangles and arrows to indicate dependencies between activities
Provide a helpful visualization of activities and their interdependencies
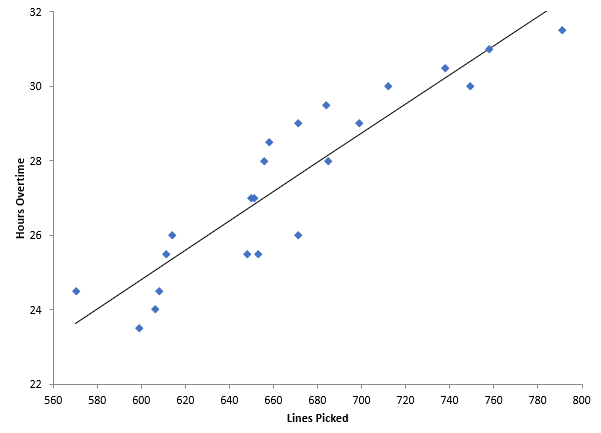
Scatter Diagram
graphical representation of the relationship between two variables
can be used for analyzing variables
involves plotting two variables, one on the x axis and one on the y axis with each being represented as a dot
EX: analyzing the relationship between advertising budget and the number of website visitors for a client’s online store

Velocity chart
used to measure the number of story points a team can complete within a given sprint or iteration
displays the number of story points completed in each iteration and plots the average velocity over time

Pareto Charts
based on Pareto principle which suggests that fixing a small portion of root causes can solve most problems, with the 8/20 rules stating that 80% of issues stem from 20% of the causes
can track the frequency of carious issue causes, allowing for prioritization of the most common issues with limited resources
bottom up estimation
begins with estimates and costs, duration, and other facets for each individual task or activity, and adds them up for a total estimation
more accurate, but is also more time-consuming way to estimate
Free Float (FF)
the amount of time that an activity can be postponed without impacting the early start of any activity that comes after it
Total Float (TF)
the total amount of time that an activity can be postponed without impacting the projects timeline
EX: in an effort to procrastinate, the user calculates the amount of time he can delay the start of the task without creating any delays for the project
Calendaring tools
allow you to create and manage calendars, set deadlines, allocate resources, and monitor progress
uses a visual representation of times frames and enable efficient management of project timelines, coordination of team members, and the avoidance of scheduling conflicts

Gantt chart
uses a grid to create a visual of the schedule
time is shown on x axis and activities on the y axis
bars show the timing of tasks and the dependencies of tasks
shows you the order in which tasks or events will occur
visual tool to help schedule and track the entire project activity over time and see dependencies
Project network diagram
used to visually represent the logical relationships and dependencies between project activities, facilitating the understanding of the projects sequence of tasks and aiding in scheduling, resource allocation, and critical path analysis
Task board
shows the work that needs to be done and what the status of the tasks are

(PERT)
Program Evaluation and Review Technique
used to estimate how long activities will take and to determine critical paths for the project
diagram that is used to plan, organize, and coordinate tasks
Shows the sequencing of tasks as well as estimates of how long activities will takes, the activities themselves, and dependencies

Run chart
also called “time series plots”
line graphs that display data over time
can be useful for root cause analysis and looking for trends
x axis shows the time or sequence
y axis shows represents the corresponding measurements
On premises installation
gives companies complete control over their software and infrastructure
software and data are hosted on their own local servers
the cost is faced up front, but they tend to have lower long-term costs because they are purchased once and don’t require continual payments

Histogram
type of column chart used in statistical analysis
x axis shows a series of continuous data points
y axis shows the frequency at which each value on the horizontal axis occurs
Workflow platforms
the best collaboration tools for tracking progress, assigning tasks, and ensuring a seamless workflow among team members, especially remote
Kanban vs Gantt charts
one is apart of agile methodology, the other can be used with a wide variety of methodologies
Local installation
access to the sfotware is more limited
sometimes limited to only a few devices that have the software installed on them
On premise installation
the software is installed on local servers and devices
Project dashboard
a communication tool that allows real time reports on a project
they can keep up to date statuses on key performance indicators and milestones
Wikis
allow for the gathering and dispersal of collective knowledge
provides one easily accessible source of information that is quick to update
File sharing platforms
the most effective collaboration tools for working on shared documents and maintaining version control among other team members
Scenario analysis
also known as situational analysis or what if analysis
involves generating potential events and evaluating their impacts
(RTM)
Requirements Traceability Matrix
tool used in project management to ensure that all requirements of a project are fullfilled
maps and tacks the relationships between requirements, design, development, its priority level, and its status

Ishiwaka Diagram
Fishbone diagram
used for root cause analysis, helps identifiy potential causes for a problem
the head represents the problem
the ribs represent possible related causes, which can be categorized using
Risk Register vs Risk report
one:
is logs that contain potential risks:
they contain a number or other ID that identifies the risk, the description, the anlayst of the risk, impact, priority, who will address it
The other:
used for analyzing risk and their potential impacts
part of the communication plan and summarize the projects risk status and how it impacts the project
it should provide sufficient information to enable stakeholders to make informed decisions and clarify when a decision is required
Charting tools
convert data into visuals which then allow the finding of trends and patterns
offers various chart types such as lines charts, bar charts, and pie charts, which can be easily understood

burndown chart
tracks two key values, target work and actual work
a line that represents the target shows the work remaining in the time period
the goal is to have the line at the bottom when all the work in completed
Late Start (LS)
last date or time that an activity can start without delaying the completion date or project
to determine late start, begin by looking at the end date of the project and determining the number of activities that depend on the completion of the item
Late Finish (LF)
last date or time an activity can finish without delaying the completion date of the project
found by adding the duration to the late start date
Process Flow Diagram
visualizes a project or process
frequently used to determine if steps can be eliminated or to see where and when handoffs occur
Sprint Reviews
meetings in which the work of the sprint if examined
Decision Tree
a tool used for planning when there is uncertainty in a project or task
poses a single question, offers multiple potential responses, and generates two or more outcomes for each option
Makes it easier to judge which option is best for the situation
made up of three components:
Decision
options
outcomes
Burnup chart vs Burndown chart
This chart tracks completed work upward against a timeline
while the other tracks remaining work downward toward zero
CPM
Critical Path Method
used to determine the sequence of dependent activities with the longest duration which represents the shortest total project duration
Task Board
shows the work that needs to be done and what the status of the tasks are
FMEA
Failure mode and effects analysis
risk analysis tool frequently used in manufacturing operation and product design
involves detailed analysis of a single process to identify multiple risks
Time tracking tools
tracks how long tasks are actually taking
Presentation
ideal for visual communications
scatter plot vs run diagram
one can be used for analyzing any variables
the other tends to be used for time based variables
Parametric model estimating
uses statistics to estimate costs, duration, or other facets of a project
uses variables like costs per hour and parameters in the statistical comparisons and mathematical models
Client TOR (terms of reference)
often focuses on a relationship rather than the deliverables
common when dealing with consultants
Mutually exclusive collectively exhaustive (MECE)
Ensures that each element in the WBS is distinct and represents the entire scope of the project
a work breakdown structure design guideline that seeks to avoid overlaps and gaps in tasks improving efficiency
Predetermined client
refers to a client who has been identified or selected in advance for a specific purpose or project
based on certain criteria such as the clients needs, preferences, industry, or potential for business growth
Kickoff meeting
has a number of goals:
lettings people know about the project
managing and setting expectation
letting team members get to know each other
answering initial questions from stakeholders
Communication artifact
can include dashboards, snapshots, presentations, press releases, and any other tangible document that provides communication
Initiation phase
The scope, objectives, and deliverables are defined, the team is brought together, existing artifacts are reviewed, access requirements are defined, and communication channels are established
a phase that identifies and evaluates stakeholders
builds the:
project charter, stakeholder engagement plan, RAM
Return on Investment (ROI) formula
(Total revenue - Total cost) / Total Cost) x 100
Responsibility Assignment Matrix (RAM)
RACI chart
project management tool that clarifies roles and responsibilities for tasks or activities
lists individuals involved in the project and specifies their roles in completing each task
designates who is:
responsible
accountable
consulted
informed
Business Analyst
acts as an intermediary between the company and the teams
understands the company’s needs and its business requirements
understands the technical aspects of the project
qualified to keep the project aligned with business requirements
Preparation phase
phase in which business case is created and contracts are reviewed
phase in which return on investment (ROI) is created and used to justify the project
Reconciling the budget
closing activity
carefully examining expenses and costs ensuring their accuracy and comparing expenses to the budget, the project manager, and others ensure that value is delivered and the money was spent responsibly
Project kickoff
live meeting that usually takes place during the initiation phase of a project
Breach of contract
occurs when one party fails to fulfill the terms and conditions specified in the agreement
Legally binding document
Planning phase
defines the units of work
determine budget considerations
Backlogs are created and then refined during the execution phase
The phase in which the initial risk assessment is the first attempt to list and assess the events that may impact the project
Monte Carlo Analysis
assesses the likelihood of a project estimate covering actual project expenses
used to determine whether the money allocated for a project will be enough the cover the actual expenses
Executive summary
a synopsis of the business case
few sentences long
recommended to be written last so it provides a good summary of what is contained in the business case
Organizational Change Management (OCM)
should involve training and lots of support from within the company
facilitates the transition
Identifying what people will need to do differently
Goal is to get users to accept the change produced by the project
commonly referred to as “the people side of change” as it recognizes that people are critical to the success of change
Ex: Meeting with office workers to explain the benefits of the new software
The options
explores three to five potential solutions providing advantages and disadvantages of each
includes the approach that explains what happens if nothing is done
Communication plan
includes goals, outcomes, channels, and artifacts
Communication Goals
build clarity early in the process and include choices about the appropriate amount of communication
EX: deciding to provide reports on progress of a project that will be sent to stakeholders every two weeks by email so that stakeholders remain informed about the project but will not be overrun with emails
Communication outcomes
what you hope will happen as a result of the communication you have sent
Communication channels
methods by which information is sent
includes email, text, websites, shared folders, and other way in which artifacts are delivered to stakeholders
Resource cost estimation
details the costs associated with each resource required for the project is resource cost estimation
involves calculating the total costs based on the cost of each resource needed for the project
Level responsibility
involves having the appropriate level of detail for the work element
focuses on breaking work down to the point that it can be completed in set amount of time and results in a measurable deliverable
managing conflict
an activity for the execution phase
these may arise among team members or with other stakeholders
During which phase is seeking feedback apart of?
Closing phase
Collaborating
involves working together, sharing ideas, and utilizing expertise to arrive at a mutually satisfactory solution
Smoothing
involves minimizing differences between conflicting parties and highlighting common interests to maintain team harmony
Execution phase
work is done and the team decides the outcomes have been met, and the product can be delivered
tracks and reports items like risks, budgets, cope, and defects
project timeline is updated
organization overview
identify stakeholders, customers, project roles, team members, and the projects organizational chart
Tools and techniques
part of the transition that lists processes and means that are needed to allow the foundation laid by the project to last into the future
25% or more change in velocity or throughput across sprints
indicates that the team should take a look at what is causing significant change
Stages in Glasls stages of conflict escalation
9 stages of conflict escalation in Glasl’s stages of conflict escalation
Stages 1-3 = “win-win” situations
Stages 4-6 = “win-lose” situations
Stages 7-9 = “lose-lose” situations
identify stakeholders
essential at the start of a project to recognize all individuals or groups who can affect or be affected by the project
Major Milestones
most appropriate topic for external stakeholder meetings
these meetings provide high level updates on the project
transition schedule
part of the transition plan that ensures people know when work on the project ends and what the go-live date is
stakeholder engagement matrix
designed to gauge the influence and interest of stakeholders in a project
evaluates stakeholders significance and impact by considering their influence on the project and their level of interest or involvement
Closing phase
Project evaluation, validation of deliverables, releasing resources are part of this phase, and collect feedback from stakeholders
Address the gaps
final step in evaluating a projects resource pool by taking actions to bridge resource deficiencies or missing elements
Solution Design
involves the architext and project team choosing technologies that align with the projects requirements
architect evaluates various tradeoffs to determine the most suitable solution, even if no option meets all requirements perfectly
Decision tree analysis
for contingency planning particularly when trying to conduct quantitative decision-making
uses paths and uncertainty to create a picture of possibilities
Plan around outcomes
guidelines that recommends focusing on the outcome rather than the tasks
based on the idea that using task level work to organize a project is too detailed
Extended team member
brought into projects due to their expertise and work temporarily with the team to address issues
Project management artifacts
include budgets and plans that are used to organize and run the project
Implementation overview
will contain the timelines and milestones, resource requirements, risks, assumptions, and budget
Project management plan
includes:
Work Breakdown structure (WBS)
baselines
milestones
approvals
Operating expenses (OpEx)
costs to the company to keep it operating
ex: a cost of a subscription
project deliverables
what the team will provide through the project
they are activities included by the projects scope and are identified in the plan
Change log
used to record project changes that occur when the project activities deviate from the project plan