Unit 3 Quiz - Quantitative Analysis of Consumer Data
 Call Kai
 Learn
 Practice Test
 Spaced Repetition
 Match
 Flashcards
 Knowt Play
1/51

There's no tags or description
Looks like no tags are added yet.
52 Terms
Linear regression
so far, we have generally assumed a linear relationship between Y and X
this is an assumption of OLS
a non-linear relationship between Y and X violates this assumption
Non-linear relationship example
See image

OLS Failure Image
See image

Can we adjust our model to still use linear regression to estimate a non-linear relationship between X and Y?
Yes! (sometimes)
How Much Would You Buy?
Extreme example:
How much more of X would you buy if Price goes $10 → $5?
???
How much more of X would you buy if Price goes $5 → $0?
???
∞
How can we get an accurate, actionable estimate of consumers responses to changes in price?
Demand curve
Change in Units Sold when Price increases by $1 is not constant
A linear regression coefficient assumes it is
Weird note: economics classes will flip these axes

Demand curve (continued)
% change in Units Sold when Price increases by 1% is constant
This is a stable empirical finding in economics
How can we capture that with regression?

Elasticities
A crucial concept in most pricing strategies is elasticity
Elasticity measures the how the percent change in one variable (e.g., price) affects the percent change in another variable (e.g., units sold)
Three common measures of elasticity in marketing/economics/business
1) own-price elasticity of demand
2) cross-price elasticity of demand
3) income elasticity of demand
own-price elasticity of demand
how does demand for a product changes when its price changes?
cross-price elasticity of demand
how does demand for one product change when the price of another product changes?
income elasticity of demand
how does demand for a product change when the customer’s income changes?
own-price elasticity of demand?
OPE = %Δ in Units Sold / %Δ in Price
Almost always negative (we like lower prices)
Inelastic Demand: -1 < OPE < 0
→ |%Δ in Units Sold| < %Δ in Price
Elastic Demand: OPE < -1
→ |%Δ in Units Sold| > %Δ in Price
Examples?
what drives OPE?
what overarching aspects of purchase decisions drive whether demand for a good/service is elastic or inelastic?
want vs need
availability of substitutes
also includes brand loyalty, inertia, switching costs, path dependence
percent of budget
time horizon
own-price elasticity of demand (regular)
Non-linear relationships between Price and Units Sold!

Variable transformations
it is common in real word data to transform variables for a variety of reasons
we have already seem examples of this → standardized regression coefficients scale variables in terms of standard deviations
one useful reason to transform variables is to create a linear relationship
in most markets, the relationship between price and sales is approximately logarithmic
own-price elasticity of demand (ln)
Linear relationship between ln(Price) and ln(Units Sold)!

Log-Log Regressions
When we run a linear regression with ln(Y) as our dependent variable and ln(X) as our independent variable…
A 1-unit increase in ln(X) predicts a β-unit change in ln(Y)
Is this helpful?
A 1% increase in X predicts a β% change in Y
This is our definition of elasticity!
→ We can easily estimate elasticities from data by running “log-log” regressions
Cross-Price Elasticity of Demand
CPE = %Δ in Units of X Sold / %Δ in Price of Y
Substitutes: CPE > 0
→ Y is an alternative to X
→ If the price of Y goes down, I buy less X and more Y
Compliments: CPE < 0
→ Y and X are used together
→ If the price of Y goes down, I buy more X and more Y
Examples?

Income Elasticity of Demand
IE = %Δ in Units Sold / %Δ in Customer Income
Inferior Goods: IE < 0
As my income goes up, I buy less
Examples?
Normal Goods: IE > 0
Necessities: 0 < IE < 1
|%Δ in Units Sold| < %Δ in Income
→ As my income goes up, I buy more at a decreasing rate
Luxuries: IE > 1
|%Δ in Units Sold| > %Δ in Income
→ As my income goes up, I buy more at an increasing rate

So far…
Basic question we’ve addressed thus far: How does X affect our prediction of Y?
Or, how does X1 affect our prediction of Y, holding other X's constant?
New question: How does the effect of X1 on our predictions of Y change depending on the value of X2?
No longer linear
Need an interaction term!
Product Reviews Interaction (Example)
You are studying the impact of a product’s average consumer rating on its sales
Would you rather buy a product with…
A) an average rating of 4.9 on 10 total reviews
B) an average rating of 4.8 on 10,000 total reviews
The effect of average rating likely depends on the total number of reviews

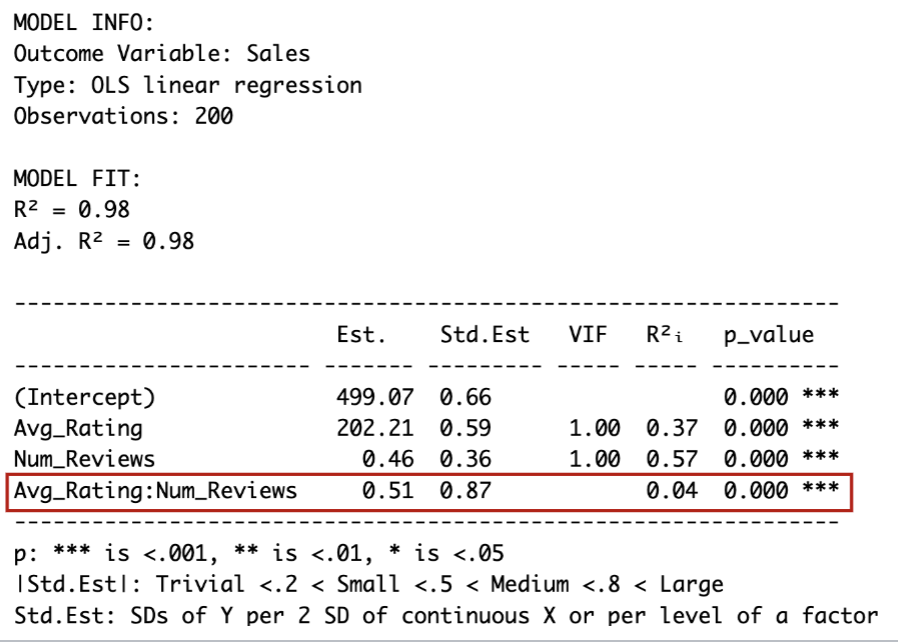
Product Reviews Interaction - R
R syntax: regmod(Y ~ X1*X2, data)
R shorthand for regmod(Y ~ X1 + X2 + X1:X2 , data)
regmod(Sales ~ Avg_rating * Num_Reviews, data = data_reviews)
The script for interpreting interactions
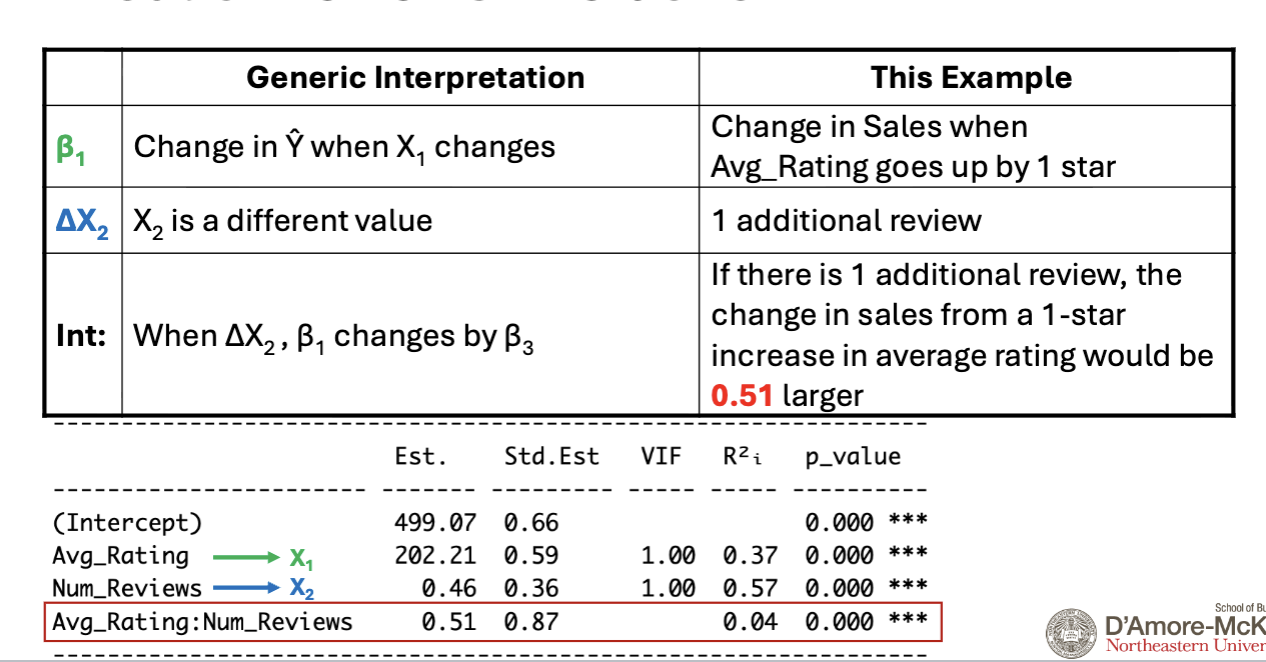
General interaction interpretation: how does the effect of one predictor change depending on the value of another predictor?
Let β1 = the effect of X1 on predictions of Y (aka Ŷ)
Let ΔX2 = what it means to change the value of X2
Interaction effect = When ΔX2 , β1 would change by β3
Note: multiplication is symmetric. Deciding which predictor is X1 and which is X2 depends on our hypothesis
X1 = "focal" variable that we are primarily interested in its impact on the outcome
X2 = "moderator" that can alter the effect of the "focal" variable

Product Reviews Interaction - R (Continued)
Table breakdown
Multicollinearity and Variable Selection
Tolerate VIFs > 10 (we are explicitly adding a correlated predictor)
regmod() suppresses the VIF for the interaction term
Multicollinearity problem if VIF for main effects > 10
Never omit the "main effects" from an interaction model
The main effects (coefficients, effect size) are no longer interpretable on their own because they now have a multiplicative effect on the outcome
The question of interest is about the interaction
Interaction R2i is generally small, even when effect size is large
The variables were already there for the model to use for predictions, the interaction term clarifies the best way to use them
You try - Income “Elasticity” (Example)
You work for a company that is trying to understand how sensitive its customers are to changes in price
You know low-income customers will be more price sensitive than high-income customers
Your goal is to see how large of an effect income has on price sensitivity
You measure total units sold to test this

You try - Income “Elasticity” (Example Continued)
If income were $1k higher, the effect of a $1 increase in price on Units Sold would be 1.06 units larger
→ note: smaller impact

Types of Interactions
Continuous X Continuous
Continuous X Categorical
Categorical X Categorical
Is Advertising More Effective for Startups? (Example)
You want to know if advertising is more effective for startups or established brands
People already aware of established brands, more ads reinforce awareness
People may be unaware of startups, more ads generate more awareness
You observe this pattern in your data but you need to formally test it
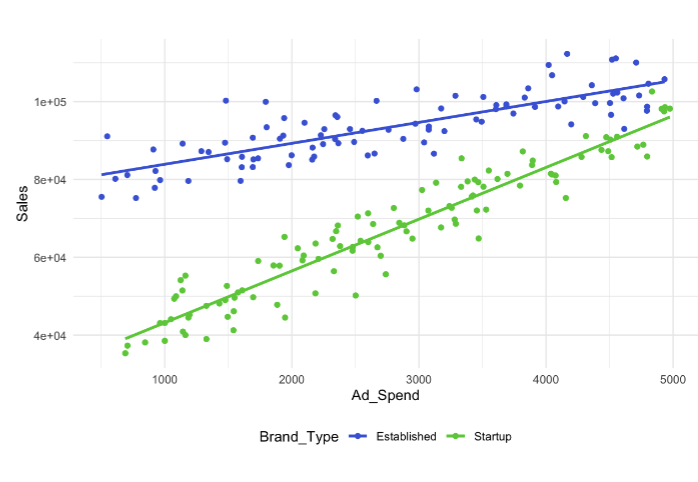
Is Advertising More Effective for Startups? (Example - R)
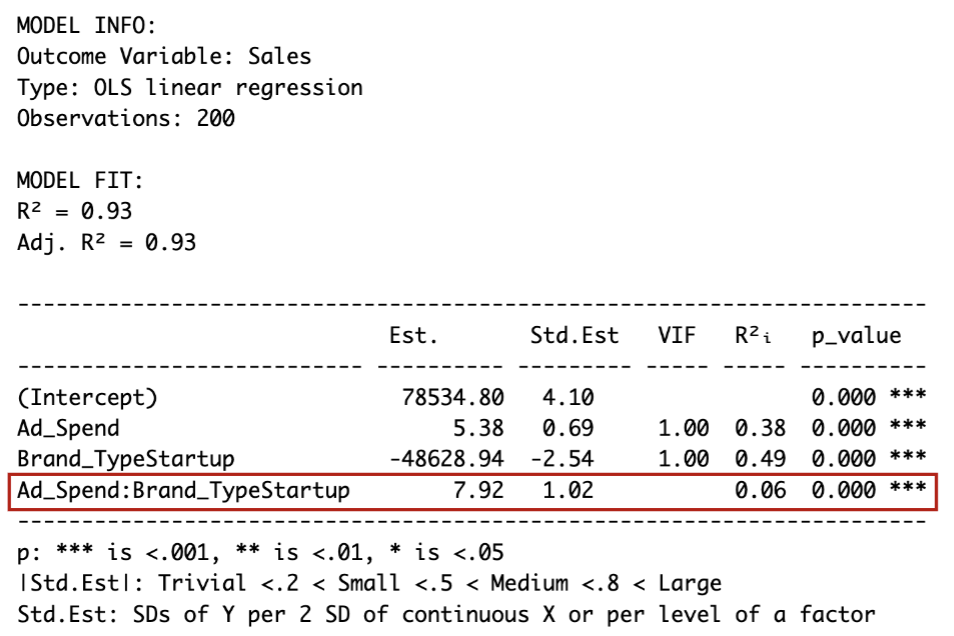
See image for output
The Script for Interpreting Interactions
Y ~ β0 + β1*X1 + β2*X2 + β3* X1 *X2
General interaction interpretation: how does the effect of one predictor change depending on the value of another predictor?
Let β1 = the effect of X1 on predictions of Y (aka Ŷ)
Let ΔX2 = what it means to change the value of X2
Interaction effect = When ΔX2 , β1 would change by β3

Startup Advertising Interaction (Continued)
See image for table breakdown

Is Advertising More Effective for Startups? (Conclusion)
Is ad spending more effective for startups?
Yes, the change in sales from a one-unit increase in Ad_Spend is $7.92 larger for startups than established brands
Slope for Startups – Slope for Established = 7.92
Slope for Established = 5.38
Slope for Startups = 13.3

You Try – Discounts for Loyalists
You work for a company that is trying to understand how loyalty membership affects discount sensitivity
You observe the data on the right and need to determine whether that interaction exists

You Try – Discounts for Loyalists (Continued)
Effect for non-members = 30.18 + 105.47 = 135.65
Effect of discount for members = 30.18
Effect of discount for nonmembers – Effect of discount for members = 105.47

Regression with Binary Outcome Variables
OLS assumes a linear relationship between the predictors and the outcome
If Y is binary (buy/didn’t buy), this is not true
Using OLS in this case violates assumptions and makes suboptimal predictions
Did a Customer Buy a Subscription? (Example)
We're doing market research studying how price impacts whether people subscribe to a streaming service
For each customer, we observe the price they saw and whether they subscribed
OLS?
Running OLS with this data reveals a glaring problem…
Predicted probabilities can fall outside [0,1]
Impossible

Logistic Regression
take the OLS line and “bend” it into a sigmoid (S-shaped) curve
this keeps predicted probabilities within [0,1]
it also improves model fit (sometimes dramatically)

Logistic Regression explained
Thus far, everything we've done has been housed under OLS
Why introduce logistic regression?
Binary outcomes are very common in marketing
Logistic regressions predict those outcomes more accurately than OLS
ML/AI
Demystifying the difference between linear and logistic regression
The way it's typically presented is odd
Logistic Regression – The Key Change
OLS assumes the effect of a predictor on the outcome is constant
When the outcome is binary, the effect is smaller near the bounds

Marginal Effect (ME):
Change in Ŷ for a one-unit change in a X, starting from a specific value of X
→ Not constant in logistic regression
How do we Capture this Nonlinearity? (marginal effect)
OLS → constant linear effect
log-log → nonlinearity captured by changing units
Interactions → nonlinearity captured by multiplicative interaction
Logistic regression → nonlinearity captured by a decay factor
Logistic Regression as Decaying ME's
In logistic regression, predictors have their largest impact when P(Y=1) = 50%
Predictors' ME's approach zero as P(Y=1) approaches 0 or 1
Why? …

Logistic Regression as Decaying ME's (Continued)
The effect of a predictor on a binary outcome combines two values
1) Maximum effect the predictor can have (i.e., ME at p̂ = 50%)
2) How that effect decays as p̂ moves away from 50%

Logistic Regression as Decaying ME's (About the Decay Factor)
Same for every predictor in every logistic regression
The decay accelerates as you approach the bounds

So How Do We Do This?
Logistic regression is simply OLS + an "activation function"

Logistic Regression = OLS + Sigmoid Activation
The GIF is real!
Mathematically, we are just applying a function to bend the OLS line
→ This lets us keep almost everything the same, just add the decay

Note on "OLS + Activation Function"
Framing logistic regression in this way has two key advantages
1) Most of our previous machinery and interpretations remain
2) This is a broader concept that generalizes outside our class
→ There are many activation functions used in other fields or for other purposes, especially in ML/AI
→ Knowing this creates an easy bridge for you
Running Logistic Regression in R
Don't ask AI to give you code for this
Default logistic regression output/interpretation is more complicated
Default R functions for it make it even more complicated
So how do we do it?
regmod() ☺

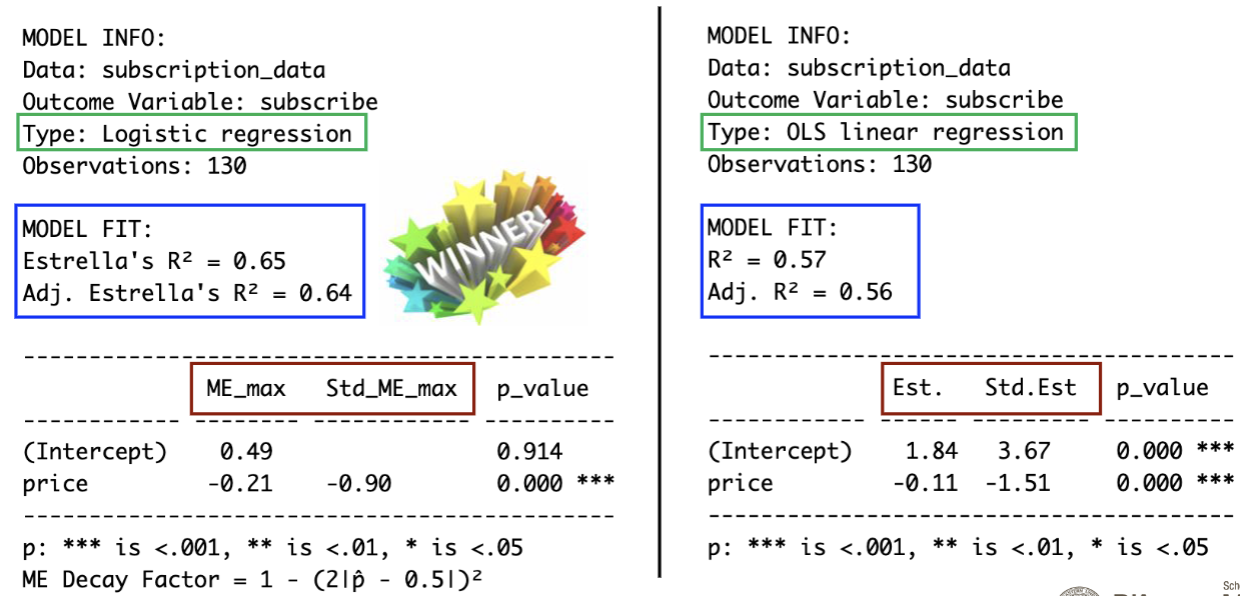
Logistic Fit > OLS Fit
Logistic regression is the winner due to a higher R²
Multiple Predictors? No Problem
• Let's say some of the customers received a free trial of the streaming service before deciding whether to subscribe
• As before, the presence of a free trial has the largest ME for customers on the fence
• The ME of price remains the same, holding trial status constant
