Econ revision
 Call Kai
 Learn
 Practice Test
 Spaced Repetition
 Match
 Flashcards
 Knowt Play
1/259

There's no tags or description
Looks like no tags are added yet.
260 Terms
Absolute Poverty
the situation where a population are unable to meet its bare subsistence needs (food, clothing and shelter) to maintain a minimum level of living.
Who’s considered to be in absolute poverty?
Those who live below the International Poverty Line ($2.50 a day)
What is the problem with measuring poverty using the IPL
normative decisions have to be made about what are ‘necessities of life’
This can occur even in just one country as what is inhumane to live without today could’ve been a luxury back in the day
The extent of poverty over/under the line isn’t captured
Relative Poverty
a condition where a household's income or disposable income is significantly lower than the typical or median income in its own country. Generally, people are considered to be relatively poor if they earn below 50% or 60% of the national median.
Neither absolute nor relative poverty…
… reflects WHERE the poverty is. For example:
between regions (north/south)
genders
rural/urban areas
Poverty Cycles
k

minimum wage
the minimum amount of remuneration that an employer can legally pay a worker
Arguments against raising minimum wage
raising minimum wage causes firms to reduce their demand for labour (to cut costs)
employers MAY replace workers with machines
rising wages = rising CoP = rising prices
Businesses that can’t afford it will go out of business
arguments for raising the minimum wage (1)
there is no definite link between minimum wage and unemployment
some things can’t be done by machines
rising wages motivates people to work more/harder which offsets rising CoP
Other arguments for raising the minimum wage
rising wages can convince some people to join the workforce
rising wages leads to rising consumption so AD and employment rise
allows people to escape the poverty trap
reduces inequality
How has globalisation and tech progression caused poverty
it has caused the D for manufacturing workers in developed nations to fall
wages for them have fallen and they’re technologically unemployed
DL for high skilled workers has risen as have their wages
income inequality has risen and the middle class is ‘hollowed out’
How have market based SSP caused poverty
Reaganomics and Thatcherism de-regulated the financial sector allowing for the rich to earn more on their investment
Union power was limited so wages have fallen without much protesting (they can’t)
the reforms also allowed for more ‘non-standard’ work (not full time)
How have tax and benefits policies caused Poverty
the top band of tax systems are falling
corporate profits, dividends, savings and capital gains are taxed at a lower rate than income
austerity
How has unequal status and power caused poverty
rich, powerful people have a disproportionate say in politics
campaigners are financed by the rich so gear their policies towards appealing to their donors
poorer people are less likely to ever be politicians and are underrepresented in politics.
How has inequality of opportunity caused poverty
the opportunities that people face are simply unequal from where we’re born to who we’re born to and so on.
how has discrimination caused poverty
for any reason (gender, age, race)
prevalent in the opportunities we receive and the outcomes of them. Poorer kids are discriminated against as they don’t have the same educational opportunities so don’t land the highest paying jobs
wage discrimination - same job but different wages for reasons unrelated to performance or skills
How has differences in human capital caused Poverty
in the last decade, skilled worker wages have risen too fast in comparison to unskilled thereby increasing inequality
How has the unequal ownership of resources caused poverty
owning physical capital - profit
owning financial capital (shares) - dividends
the higher your income, the more likely you are to own those things and their value rises a lot faster than wages
Poverty is measured…
,,, in each country by a national poverty line which is a % of median income (usually 50-60)
Poverty Indices
Human Suffering Index - Ranks the levels of suffering experienced by poor people of calorie intake, supply of clean water and more
Multi dimensional poverty index - uses 10 indicators to show deprivation in education, health and living standards
a person is multi-dimensionally poor if they’re depraved in 1/3 of the indicators
challenges in measuring poverty
difficult to define (Absolute, Relative, Multi-dimensional) so hard to measure
some elements are impossible to measure like the anxiety of not knowing when the next meal is
a Govt can edit the poverty line and the definition to make it look like poverty has lessened
The results are often from household surveys. results may be worse in a country with less resource
The Lorenz Curve…
…can be used to:
compare income distribution in 2 or more countries
compare income distribution in a country over time
How to calculate a Gini index value from a Lorenz curve
Area A / (Area A + Area B)

Consequences of Poverty and Inequality for Economic Growth
it can be a motivator for the poorest to improve skills and gain an education to ascend the classes
A more equal society has no drive and no pools of money needed to invest
higher levels of poverty and inequality means fewer opportunities for poor people which traps them in a vicious cycle. Kids finish school with a basic education so productivity and EG fall
Consequences of Poverty and Inequality for living standards & social stability
wide income disparity means anyone below the average is poor
poor people have to decide what to/what not to buy
in unequal societies, neighbourhoods and regions may be known rich/poor and may be self perpetuating
concentrated council housing leads to an area with poorer infrastructure and education
poorer areas have high hostility which leads to rising tension and crime
Policies to redistribute income/wealth & lower poverty
Broader access to education in marginalised communities
improve provision of housing, electricity etc
improve access to essential healthcare services
introduce/increase state pension
taxes (Inheritance, progressive)
minimum wages
means tested benefits
What is the Marginal rate of tax
the % of tax paid on the NEXT pound you earn
What is the average rate of tax
the total tax a person paid / their income x 100
what is a regressive tax
A regressive tax is a tax that takes a larger percentage of income from low-income earners than from high-income earners
What is Monetary Policy
the set of official policies governing the supply of money and level of interest rates in a country
Who uses MP
a central bank (the bank for banks and the G)
two types of MP
Expansionary MP - raises AD and lowers IR
Contractionary MP - lowers AD and raises IR
how has monetary policy evolved over time in the UK?
1980s - German mark was shadowed to control inflation + strong belief in monetarist theories
‘90 - UK entered EU ERM
‘92 - ‘97 - UK leaves EU ERM (Black Wednesday) and moves back to floating xchange rates set by the G
‘97 - now - The BofE set up to be independent to the G and MPC set up to set IR
How did the European Union Exchange Rate Mechanism (EU ERM) work
Worked by setting an agreed upon central xchange rate for partaking currencies against the ECU and allowing fluctuations (+ or - 6%) in the UK’s case
What happened on Black Wednesday?
16th Sept 1992
the £ fell by >6% against the ECU
The govt tried to perk up the GBP by buying it up with foreign currency reserves and raising IR upto 12% in a day
to no avail as the UK left the EU ERM
Strengths of MP
easily implemented (IR can be altered quickly by BofE)
The BofE is independent - politics don’t impede its function
There’s no crowding out (only IR is affected)
Precise changes can be made - IR can be altered by as little as +- 0.25% (fine tuning)
Weaknesses of MP
time lags - AD takes time to reply to changes in IR
If IR is already low its ineffective at raising AD
if confidence is already low (esp in a recession) lowering IR does nothing
What is credit creation
credit creation occurs when banks lend money to customers, they’ll receive a deposit and loan out more as a multiple of the deposit
what is the minimum reserve requirement (MRR)
the % of a deposit that banks are legally required to hold in reserve incase the depositor needs it (the uk doesn’t have one)
how does credit creation work
someone deposits 100k into my bank (MRR is 20%)
i divide it into 5 packets of 20k (the mrr)
i keep one for the depositor
the remaining 4 i use as the MRR and grant 4 ×100k loans
(I just created 400k)
money multiplier formula
1/mrr
How is the MRR used to control the money supply
if the BofE raises the MRR the multiplier decreases (inv. proportional) this will lower credit creation which lowers money supply which raises IR - (this is contractionary MP)
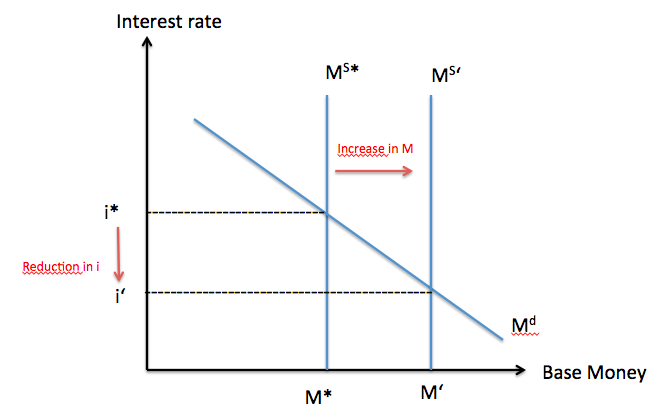
how do open market operations to control money supply
this involves buying&selling of govt securities (bonds) by the BofE (low risk and redeemable after a few years)
If the BofE wants contractionary MonetaryPolicy they’ll sell the securities - decreases funds and lowers money supply (IR rises and C+I fall)
(expansionary MP is the opposite)
what does the open market operations diagram look like
did you get it?
what are 3 ways of saying the base rate
minimum lending rate
refinancing rate
discount rate
How does the BofE alter the base rate to control money supply
this is the IR for banks and it influences our own IR
If the BofE wants CMP they’ll raise base rate which raises commercial IR which decreases borrowing snd raises savings so c+i fall as does AD
(EMP the opposite of what i just said)
What is Quantitative Easing (QE)
the introduction of new money into an economy
Expansionary MP
a common form of EMP since ‘08 when IR was low and demand wasn’t rising
steps to QE
Central bank buys securities off of financial institutions
this gives them more reserves - more liquidity (encourages more lending as IR is low too)
C+I rises as does AD
low IR = low xchange rates which raises (x - m)
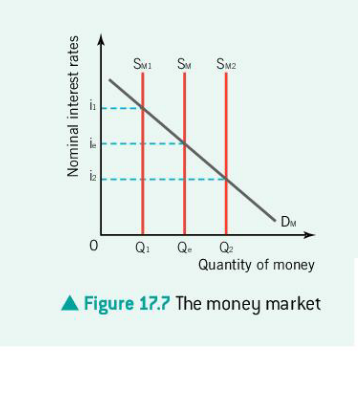
Interest rates are
The price (opportunity cost) of having money OR the reward for saving
Real IR =
Nominal IR - inflation rate
money market diagram
did you get it?
What is fiscal policy (FP)
When tax revenue and government expenditure are used to influence an economy
the 3 types of public spending
Capital spending (investing in Capital stock)
Current spending (ongoing payments)
Transfers (benefits and other things which the G doesn’t expect back)
Aims of FP
maintain a low and stable rate of inflation
a low unemployment rate
stable environment for long term growth
promote an equitable distribution of income
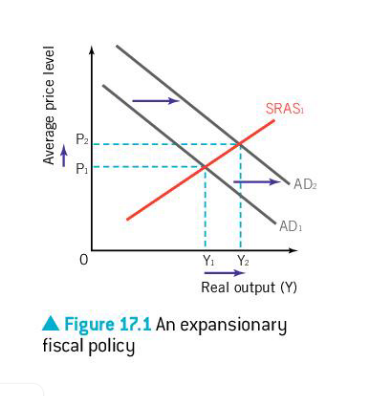
What is Expansionary FP
The G can lower income tax which raises disposable income which raises consumption
The G can lower corporate taxes which increases profit and increases investment
the government can raise their own spending which increases AD
(EFP is a trade off between lower unemployment and inflation
expansionary FP diagram
did you get it
aims of contractionary FP
control economic growth
curb inflation
lower a budget deficit
Strengths of FP
Great at dealing with recessions (Great Depressions and 2008 World Depression)
Govt expenditure can be used to target certain sectors
Tax cuts can also be targeted
Constraints of Fiscal policy
Time lags (Tax cuts have to be changed democratically and once changed it takes a while to see effects)
Political pressure (the govt won’t raise taxes if they wanted to keep power)
Too much EFP leads to unsustainable debt
crowding out - a rise in The G borrowing leads to them monopolising the available funds so the rise in G spending is negated by the fall in investment
What is Government (national) debt
the accumulation of all the budget deficits over the years & [as a % of GDP] , the amount owed to creditors
what are Debt Servicing costs
the amount of money needed to make payments on the principal & interest of a loan in a given time period
what are the costs of running high government debt
crowding out
rising debt servicing means the G will cut back in other sectors
and if they don’t cut back they’ll raises taxes which leads to falling income and output
Govts with large debts have fewer options when it comes to responding to crises
What is the multiplier effect
an injection of g. spending leads to a larger final increase in national income and GDP. one person's spending becomes another person's income, triggering multiple rounds of subsequent consumption.
how does the multiplier effect work
G. spending and Business investments are injections into the circular flow
these injections are then multiplied through the economy
people receive a share and then spend a part of what they receive
what is the Marginal propensity to consume
the proportion of an extra unit of income that will be spent as opposed to saved
what are the two keynsian multiplier formulae
multiplier = 1/1-mpc or 1/mpw (
what is the MPW
MRT + MPM + MPS
What is a market failure
A situation where the free market equilibrium does not lead to the socially optimal allocation of resources
What is an externality
indirect costs/benefits imposed on uninvolved third parties resulting from an economic transaction or activity
MSC (Marginal social cost)
The additional cost to society from producing one more unit of a good
MSC = MPC - MEC
MSB (Marginal social benefit)
The additional benefit society gains from the consumption of an extra unit of a good
MSB = MPB - MEB
When MSC = MSB
there are no externalities
we have reached maximum community (or society) surplus and so therefore we have reached allocative efficiency
socially optimal point
When externalities exist in a market
MSC doesn’t = MSB
inefficient allocation of resources
we get a maket failure
What are the 4 types of externality
Positive Consumption Externalities
Negative Consumption Externalities
Positive Production Externalities
Negative Production Externalities
What are positive externalities of consumption
Any good/service that, when consumed, benefits both the consumer and also third parties not involved in the transaction
(For example getting vaccinated benefits you as you won’t get sick but society benefits too as you can’t infect anyone else)
UNDERconsumed
What are positive externalities of Production
Any good/service that, when produced, benefits third parties not involved in the transaction
By going to school and seeking further education, you are becoming a more skilled worker and will greatly benefit future employers
UNDERproduced
When drawing production externality diagrams
For -ve PE
MSC > MPC
For +ve PE
MSC < MPC
MSB = MPB FOR BOTH (as we assume there are no consumption externalities)
What are negative externalities of Consumption
Any good or service that, when consumed, negatively affects third parties
When you choose to smoke, the public is subject to second hand smoking
OVERconsumed
What are negative externalities of Production
These occur when the production of a good or service creates external costs that are damaging to third parties. (Usually environmentally damaging)
Any type of factory has these
OVERproduced
When drawing Consumption Externality diagrams
For -ve CE
MPB > MSB
For +ve CE
MPB < MSB
MSC = MPC FOR BOTH (as we assume there are no production externalities)
What are demerit goods
Goods that are harmful to consumers, but people who consume them are either unaware of the possible harm, or ignore the risks
Consumers have imperfect information about the risks to themselves and to others (demand is higher than it should be)
all demerit goods create negative externalities
What are merit goods
Goods that are beneficial to consumers, but are under consumed as people underestimate the potential benefits , or choose to ignore the potential benefits
Consumers have imperfect information about the benefits to themselves and to others (demand is lower than it should be)
all merit goods create positive externalities
How do you draw an Externalities diagram
Is it Production or Consumption
Consumption diagrams have 2 benefits curves and Production diagrams have 2 cost curves
Is it positive or negative
this determines which cost/benefit curve goes above the other one
Free Market Equilibrium (MPC = MPB)
Allocatively efficient point (MSB = MSC)
Welfare gain
The triangle with the tip at the Allocatively efficient point
Over/Under Production/Consumption
In the free market
Externalities aren’t considered at all and this is reflected in the prices of goods and services
Marginal Private Cost
is the same as supply in an externalities diagram
the additional costs affecting a firm when they seek to produce an extra unit of good or service
Marginal Private Benefit
is the same as demand in an externalities diagram
the additional benefits affecting the individual when they seek to consume an extra unit of good or service
External Benefit
The benefit provided to 3rd parties outside the market trade
External Cost
The cost provided to 3rd parties outside the market trade
The price at the socially optimal point
is the value the good has to us after we consider the effect on third parties
Market Equlibrium
when supply meets demand
efficient resource allocation
All that is bought is sold. ALLOCATIVE EFFICIENCY is achieved
Surplus and Shortage
Surplus - Demand < Supply [excess supply]
Shortage - Demand > Supply [excess demand]
How does excess demand [a shortage] self correct
currently more is being demanded than supplied
the price of the good rises (firms do this)
demand contracts and supply extends until they meet and the market clears
How does excess supply [a surplus] self correct
currently more is being supplied than demanded
the price of the good falls
demand extends and supply contracts until they meet and the market clears
what effect do the following shifts have on price and quantity:
Rightward shift in Demand
Rightward shift in supply
leftward shift in supply
leftward shift in demand
Price and Quantity rise
Price falls, quantity rises
price rises, quantity falls
price and quantity fall
General chain of reasoning
A shift in either supply or demand (for whatever reason)
Excess supply or demand
price either rises or falls to clear excess
new equilibrium is established (it is always in the middle)
What’s another name for the price mechanism
Supply and demand
signalling function of price (there are three total functions)
the actions of consumers and producers set the price in a market
the prices reflect changing circumstances
the prices then tell producers/consumers how to act
Rationing function of price
resources are scarce
the price of any good is so that only those willing AND able will have the good rationed out amongst them
(If demand rose and supply decreased only those who were most willing and able could get the good)
incentive function of price
lower prices incentivise consumers to buy more (utility to price ratio is large)
high prices incentivise producers to make more (they’ll maximise profit)
(assuming they’re all rational)