Econ Practice Questions
 Call Kai
 Learn
Learn Practice Test
 Spaced Repetition
 Match
Match Flashcards
 Knowt Play
1/79

There's no tags or description
Looks like no tags are added yet.
Name | Mastery | Learn | Test | Matching | Spaced | Call with Kai | Chat |
|---|
No analytics yet
Send a link to your students to track their progress
80 Terms
The basic ingredient(s) in any economic decision
are surpluses and shortages, which are cause by prices.
is scarcity, which forces people to make choices, which creates opportunity costs.
are market prices and the use of efficient production methods.
are needs, which people must choose instead of wants.
is scarcity, which forces people to make choices, which creates opportunity costs
The opportunity cost of going to college is
zero for students who are fortunate enough to have all of their college expenses paid by someone else.
zero, since a college education will allow a student to earn a larger income after graduation.
the value of the best opportunity a student gives up to attend college.
the total spent on food, clothing, books, transportation, tuition, lodging, and other expenses.
the value of the best opportunity a student gives up to attend college.
Which of the following is an example of rational economic behavior?
When an option becomes more expensive, people will be less likely to choose it.
When the cost of doing something goes up, people do more of it.
The value of a good is determined objectively by the labor used to produce it, and is the same for everyone.
All of the above.
When an option becomes more expensive, people will be less likely to choose it.
Most people only buy or rent a single home. This is because
Taxes cause a second home to be much more expensive than the first.
Buying a second home requires special regulatory approval.
The marginal benefit of a second home is much lower than the marginal benefit of the first home, but the second home is still very costly.
The marginal benefit of a second home is too high for consumers to consider it.
The marginal benefit of a second home is much lower than the marginal benefit of the first home, but the second home is still very costly.

Tn the figure above, point A is
inefficient.
unattainable.
efficient
preferable to point B.
inefficient.

Refer to the figure above. If the economy moves from point A to D, the opportunity cost is
10 toasters.
20 toasters.
30 toasters.
30 toothbrushes.
20 toasters.
John can produce 10 pens or 20 pencils in one hour while Ashley can produce 15 pens or 5 pencils in one hour. Which of the following statements is correct?
Ashley has a comparative advantage over John in the production of pencils.
Ashley has a comparative advantage over John in the production of pens.
John has a comparative advantage over Ashley in the production of pens.
Ashley and John cannot benefit from specialization and exchange.
Ashley has a comparative advantage over John in the production of pens.
The law of demand refers to the
inverse relationship between the price of a good and the quantity that consumers are willing to buy.
price increase that results from an increase in demand for a good of limited supply.
inverse relationship between the price of a good and the quantity offered for sale.
increase in the quantity of a good available when its price increases.
inverse relationship between the price of a good and the quantity that consumers are willing to buy.
Two products that serve similar purposes for a consumer would be referred to as
inferior goods.
complements.
substitutes.
unrelated goods.
substitutes.
When economists say the demand for a product has decreased, they mean
the demand curve has shifted to the left.
the product price has increased, and as a consequence, consumers are buying less of the product.
consumers are now willing and able to buy more of this product at each possible price.
the demand curve has shifted to the right.
the demand curve has shifted to the left.
In which statement(s) are "demand" and "quantity demanded" used correctly?
Assuming peanut butter and jelly to be substitutes,
(1) "an increase in the price of peanut butter will reduce the quantity demanded of peanut butter."
(2) "an increase in the price of peanut butter will reduce the demand for jelly."
in statement 1 only
in statement 2 only
in both statements 1 and 2
in neither statement 1 nor 2
in both statements 1 and 2
The Law of Demand says that if the price of strawberries falls from $4 per pound to $3 per pound, the quantity of strawberries purchased by consumers will
rise.
fall.
stay the same.
rise by 25%.
rise
Which of the following statements is correct?
A change in quantity demanded is a shift of the entire Demand curve. A change in Demand is a movement along the Demand curve.
A change in quantity demanded is a movement along the Demand curve. A change in Demand is a shift of the entire Demand curve.
Quantity demanded cannot change; only Demand can change.
Demand cannot change; only quantity demanded can change.
A change in quantity demanded is a movement along the Demand curve. A change in Demand is a shift of the entire Demand curve.
This is a multiple answer question. That means there may be more than one correct answer (or maybe not); you must select all correct answers.
Which of the following describes a movement along the demand curve, and not a shift of the demand curve?
The price of corn falls, and as a result, consumers buy more corn.
Because people hear that High Fructose Corn Syrup is unhealthy, they buy less of it, and as a result, food processing businesses choose to buy less corn at every price.
The price of MicroSD memory cards rises, and as a result, consumers buy fewer MicroSD memory cards.
A new, faster digital memory card format is released, and as a result, people buy fewer MicroSD cards.
People buy fewer printed books due to a drop in the price of e-books. (Focus on what happened with printed books. Is it a shift in demand, or a movement along the demand curve?)
The price of corn falls, and as a result, consumers buy more corn.
The price of MicroSD memory cards rises, and as a result, consumers buy fewer MicroSD memory cards.
Some students attend FSU, and some other students attend UF. Suppose tuition at UF rises from $7,000 per year to $15,000 per year. What will happen with the Demand curve for FSU?
A movement along the demand curve will occur, resulting in higher quantity demanded.
A movement along the demand curve will occur, resulting in lower quantity demanded.
A shift in demand will occur, resulting in a decrease in Demand for FSU.
A shift in demand will occur, resulting in an increase in Demand for FSU.
A shift in demand will occur, resulting in an increase in Demand for FSU.
If Good X is an inferior good, an increase in income will cause
demand to shift to the right.
demand to shift to the left.
demand to stay the same.
price to rise.
demand to shift to the left.
Which of the following would cause the demand for a good to shift to the left?
an increase in the number of buyers
new information causes consumers to expect the price to rise in the near future
the good becomes unfashionable
none of the above
the good becomes unfashionable
The price of Good A rises, and this causes consumers to buy less of Good B. Goods A and B must be:
inferior
normal
complements
substitutes
complements
Which of the following causes a demand curve to shift?
changes in non-price determinants
an increase in price
a decrease in price
all of the above
changes in non-price determinants
A TikTok trend makes salsa dancing suddenly more popular among college students. What happens to the market for salsa classes?
Demand shifts right.
Demand shifts left.
There is movement down the demand curve.
There is movement up the demand curve.
Demand shifts right.
The Law of Supply says that ...
as price rises, quantity supplied rises.
as price rises, quantity supplied falls.
as price rises, supply rises.
as price rises, supply falls.
as price rises, quantity supplied rises.
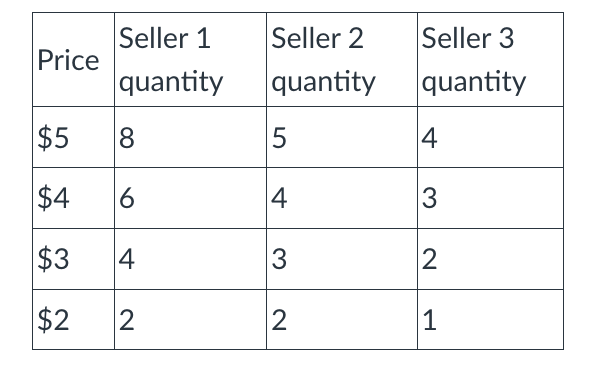
If the price is $3, the quantity of hamburgers supplied in this market would be ...
9
4
3
2
9
Growing bananas requires a great deal of potassium fertilizer. If the price of potassium fertilizer rises, which of the following will occur?
The quantity of fertilizer supplied will decrease.
The supply curve for bananas will shift to the right.
The supply curve for bananas will shift to the left.
None of the above.
The supply curve for bananas will shift to the left.

Refer to the image below.
If supply moves from S1 to S2, this is an ...
increase in supply.
decrease in supply.
decrease in quantity supplied.
none of the above.
increase in supply.
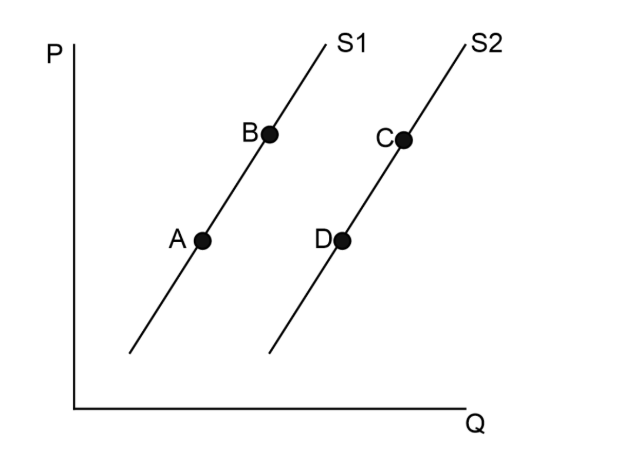
Suppose that the relevant supply curve is S1. A movement from point A to point B would occur because of ...
an increase in supply.
a decrease in supply.
an increase in quantity supplied.
an increase in price.
an increase in price.
Which of the following would cause a supply curve to shift to the right?
A decrease in the price of inputs.
An increase in the tax placed on the good being produced.
A decrease in a government subsidy for the good being produced.
A decrease in the price of the good being produced.
A decrease in the price of inputs.
Which of the following could cause a decrease in the supply of wheat?
A decrease in the cost of fertilizer.
A colder-than-usual winter that freezes the crop.
A subsidy for wheat producers.
New information that suggests the price of wheat will decrease next week.
A colder-than-usual winter that freezes the crop.

Given the supply and demand conditions illustrated above, the equilibrium price of bananas is:
$1
$2
$3
$4
$3

In the figure above, D1 and S indicate the initial conditions in the market for ice cream. Which of the following changes would tend to cause the shift from D1 to D2 in the market for ice cream?
A decrease in the price of sugar, an ingredient used to produce ice cream.
An increase in the price of frozen yogurt, a substitute for ice cream.
Abnormally cold weather that decreased consumer desire for ice cream.
An increase in the price of milk, an ingredient used to produce ice cream.
An increase in the price of frozen yogurt, a substitute for ice cream.
A new hormone will increase the amount of milk each cow produces. If this hormone is adopted by many dairies, what will be the effect on the milk market?
An increase in supply, higher equilibrium price, and lower equilibrium quantity
An decrease in supply, lower equilibrium price, and lower equilibrium quantity
An increase in supply, lower equilibrium price, and higher equilibrium quantity
An decrease in supply, lower equilibrium price, and higher equilibrium quantity
An increase in supply, lower equilibrium price, and higher equilibrium quantity
An increase in the price of metal raises the cost of manufacturing dishwashers. As a result, the market changes to a new equilibrium because of:
a surplus of dishwashers.
a rightward shift in the supply curve for dishwashers.
a leftward shift in the demand curve for dishwashers.
a leftward shift in the supply curve for dishwashers.
a leftward shift in the supply curve for dishwashers.
Suppose demand decreases and supply decreases. Which of the following will happen?
Equilibrium price will rise, fall, or stay the same while equilibrium quantity will decrease.
Equilibrium price will rise, fall, or stay the same while equilibrium quantity will increase.
Equilibrium quantity will rise, fall, or stay the same while equilibrium price will increase.
The change in equilibrium price and quantity cannot be determined.
Equilibrium price will rise, fall, or stay the same while equilibrium quantity will decrease.

Given the demand and supply conditions shown above, if the government imposes a price ceiling of a, what would be the quantity consumers would like to buy and the amount producers would be willing to supply?
Consumers would want to buy t, and producers would be willing to sell r.
Consumers would want to buy r, and producers would be willing to sell t.
Consumers would want to buy t, and producers would be willing to sell s.
Consumers would want to buy s, and producers would be willing to sell s.
Consumers would want to buy t, and producers would be willing to sell r.

Refer to the figure above. Suppose a price floor of $7.00 is imposed. As a result,
the quantity demanded will fall to 40 units, and there will be a surplus of this good.
the supply curve will shift to the left so as to now pass through the point Q=40, P=$7.00.
the quantity demanded decreases by 20 units.
the quantity supplied will be less than the quantity demanded.
the quantity demanded will fall to 40 units, and there will be a surplus of this good.
Rent controls (limits on apartment rent increases) tend to cause imbalances in the market for housing because
quantity demanded exceeds quantity supplied but price cannot rise to remove the shortage.
quantity demanded exceeds quantity supplied but price cannot fall to remove the surplus.
quantity supplied exceeds quantity demanded but price cannot rise to remove the shortage.
quantity supplied exceeds quantity demanded but price cannot fall to remove the surplus.
quantity demanded exceeds quantity supplied but price cannot rise to remove the shortage.
Your friend says: "I don't understand how anyone could oppose a price ceiling. Everyone knows cheaper is better. Why not just make everything cheaper by law? We could all afford the things we need."
How might an economist respond to this statement?
There is nothing wrong with this statement from an economist's point of view.
Cheaper goods are bad because they hurt corporate profits.
Cheaper goods are always of low quality, which would make consumers worse off.
Making goods cheaper by law does not make them abundant; at the lower price, producers may supply less, leaving some consumers unable to buy the good at all.
Making goods cheaper by law does not make them abundant; at the lower price, producers may supply less, leaving some consumers unable to buy the good at all.
A tax that is legally imposed on producers will:
cause demand to shift to the left.
cause demand to shift to the right.
cause supply to shift to the left.
cause supply to shift to the right.
cause supply to shift to the left.
A tax that is legally imposed on consumers will:
cause demand to shift to the left.
use demand to shift to the right.
cause supply to shift to the left.
cause supply to shift to the right.
cause demand to shift to the left.
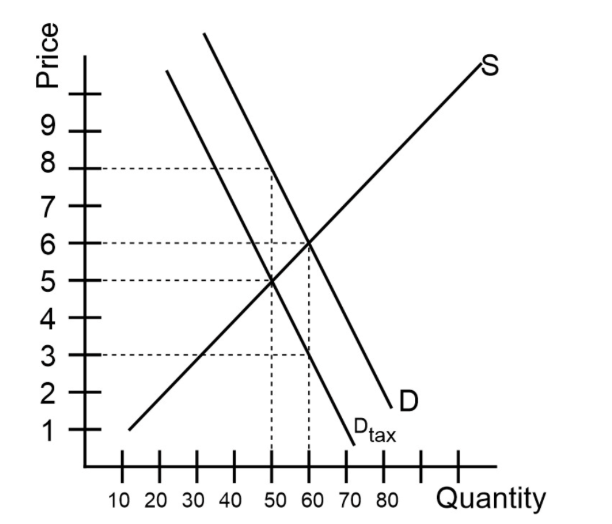
Refer to the figure above. What statement is correct for this tax that has been imposed on consumers?
Consumers pay $9 per unit, including the tax. Sellers receive $8 per unit.
Consumers pay $8 per unit, including the tax. Sellers receive $6 per unit.
Consumers pay $8 per unit, including the tax. Sellers receive $5 per unit.
Consumers pay $5 per unit, including the tax. Sellers receive $3 per unit.
Consumers pay $8 per unit, including the tax. Sellers receive $5 per unit.
Suppose the supply and demand functions for the labor market are as follows, where L stands for quantity of labor (in thousands) and W stands for wage (in dollars per hour):
Demand: LD=90-3W
Supply: LS=7W
Compute the market equilibirum wage.
9
8
7
4
9
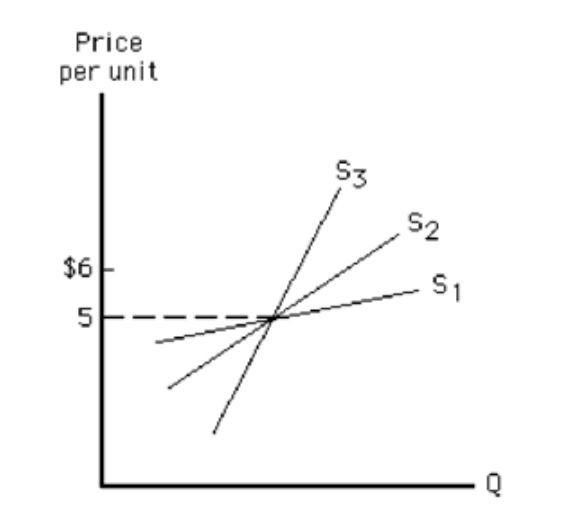
Consider the figure above. Between prices of $5 and $6, which supply curve is most elastic and which is least elastic?
S1 is most elastic; S2 is least elastic.
S1 is most elastic; S3 is least elastic.
S3 is most elastic; S1 is least elastic.
S2 is most elastic; S3 is least elastic.
S1 is most elastic; S3 is least elastic.
The demand for Chocolate Chip Cookie Dough ice cream is likely quite elastic because
ice cream must be eaten quickly.
this particular flavor of ice cream is viewed as a necessity by many ice-cream lovers.
the market is broadly defined.
other flavors of ice cream are good substitutes for this particular flavor.
other flavors of ice cream are good substitutes for this particular flavor.
If the quantity demanded of a product rose from 900 to 1,200 when the price of the product fell from $11 to $9, the price elasticity of demand is equal to
0.20
0.70
1.00
1.42
1.42
Gabriela recently got a 10 percent raise. She now purchases 30 percent more in groceries on a weekly basis. Gabriela's income elasticity for groceries is:
0.33
0.5
1
3
3
A perfectly inelastic demand curve indicates that
a producer can sell as many units as desired at the market price but no units above the market price.
for a given percent change in price, the quantity demanded rises by some percentage.
price has no effect on the quantity demanded.
the percent change in price is less than the percent change in quantity demanded.
price has no effect on the quantity demanded.
The price elasticity of supply
will be positive when supply is elastic and negative when it is inelastic.
will be negative when supply is elastic and positive when it is inelastic.
will always be positive.
will be positive when demand for the good is inelastic.
will always be positive.
In general, elasticity refers to
a calculation of quantity divided by price.
a unit-free measurement of how one economic variable changes in response to another economic variable.
a way to determine how consumers should behave.
percent change in price divided by percent change in quantity.
a unit-free measurement of how one economic variable changes in response to another economic variable.
The price of Gala apples rises from $5 per pound to $10 per pound. As a result, the quantity demanded falls from 10 million pounds to 5 million pounds. What is the Arc (or midpoint) Own-Price Elasticity of Demand? (Express it in absolute value.)
1.00
-1.00
2.00
-2.00
1.00
The price of peanut butter rises from $1 per jar to $2 per jar. The quantity of grape jelly consumed falls from 6 million jars per year to 2 million jars. What is the arc (or mid-point) Cross-Price Elasticity of Demand?
1.5
2.0
1.0
0.5
1.5
You take a new job, raising your income from $50,000 per year to $70,000 per year. As a result, you decide to take two vacations per year, instead of one. What is your Arc Income Elasticity of Demand?
3.00
2.00
2.5
1.0
2.00
Suppose the Arc Own-Price Elasticity of Demand for gasoline is 0.15. Which of the following is correct?
If the price of gasoline rises by 1%, the quantity demanded will fall by 0.15%.
If the price of gasoline rises by 1%, the quantity demanded will fall by 15%.
If the quantity of gasoline rises by 1%, the price will fall by 0.15%.
If the price of gasoline rises by 1%, the quantity demanded will rise by 0.15%.
If the price of gasoline rises by 1%, the quantity demanded will fall by 0.15%.
Your Income Elasticity of Demand for flip-flops in -0.1. What sort of good are flip-flops for you?
Correct answer:
Flip-flops are an inferior good.
Flip-flops are a substitute.
Flip-flops are a complement.
Flip-flops are a normal good.
Flip-flops are an inferior good.
We use the midpoint (arc) formula for calculating elasticity because
the midpoint formula is more consistent, as it gives the same elasticity number whether we are moving from point A to point B, or from point B to point A.
the midpoint formula avoids negative numbers.
the midpoint formula avoids the double coincidence of wants problem.
all of the above.
the midpoint formula is more consistent, as it gives the same elasticity number whether we are moving from point A to point B, or from point B to point A.
The price of bananas undergoes two changes.
First, it falls from $3 to $2 per pound, and the quantity of bananas purchased goes from 100 tons to 120 tons.
Second, it falls from $2 to $1 per pound, and the quantity of bananas purchased goes from 120 tons to 140 tons.
Which answer below contains the correct own-price elasticity of demand for the first price change and the second price change?
First price change: 0.45
Second price change: 0.23First price change: 0.6
Second price change: 0.33First price change: -0.6
Second price change: -0.33First price change: -0.45
Second price change: -2.3
First price change: 0.45
Second price change: 0.23
Suppose the price of gasoline rises to $7.00 per gallon (which, in U.S., is an unusually high price). Which of the following is correct?
In the short run, demand will be relatively inelastic, so consumers cannot easily reduce gasoline consumption. In the long run consumers will find alternatives (such as carpooling, moving closer to work, or buying more fuel-efficient vehicles), and gasoline demand becomes more elastic.
In the short run, demand will be relatively elastic, so consumers can easily reduce their gasoline consumption. In the long run consumers will be unable to find alternatives to using gasoline because of legal restrictions, so gasoline demand will become more inelastic.
In the short run, demand will increase, but the increase in price will cause supply to increase, driving the price down.
In the short run, demand will be inelastic, and elasticity will fall further as the price moves us up and to the left along the demand curve.
In the short run, demand will be relatively inelastic, so consumers cannot easily reduce gasoline consumption. In the long run consumers will find alternatives (such as carpooling, moving closer to work, or buying more fuel-efficient vehicles), and gasoline demand becomes more elastic.
Which of the following is correct regarding the price elasticity of supply in the short and long run?
Supply becomes more elastic as time passes.
Supply becomes less elastic as time passes.
Supply stays inelastic in the short run and the long run.
Supply elasticity is equal to demand elasticity in the long run.
Supply becomes more elastic as time passes.
The price of good A rises from $50 to $100, and the quantity of good B rises from 100 units to 400 units. Which of the following is correct?
Midpoint (or Arc) Cross-Price Elasticity is 1.8, and these goods are substitutes.
Midpoint (or Arc) Cross-Price Elasticity is 3, and these goods are complements.
Midpoint (or Arc) Cross-Price Elasticity is 0.33, and these goods are substitutes.
Midpoint (or Arc) Cross-Price Elasticity is 1.8, and these goods are complements.
Midpoint (or Arc) Cross-Price Elasticity is 1.8, and these goods are substitutes.
Generally speaking, what is elasticity?
A measure of how much price responds to a quantity change.
A measure of percent change.
A unit-free measure of how one thing responds to changes in another thing.
A measure of inequality.
A unit-free measure of how one thing responds to changes in another thing.
The Cross-Price Elasticity of Demand for good X is -0.79, relative to good Y's price. How are goods X and Y related,
They are substitutes.
They are complements.
They are both normal goods.
Both goods violate the law of supply.
They are complements.
Your boss offers you a raise from $10 per hour to $15 per hour. As a result, you decide to drop a class and work 25 hours per week, rather than 15 hours per week you were previously working. What is your Arc Price Elasticity of Supply?
1.25
1.00
1.50
2.00
1.25
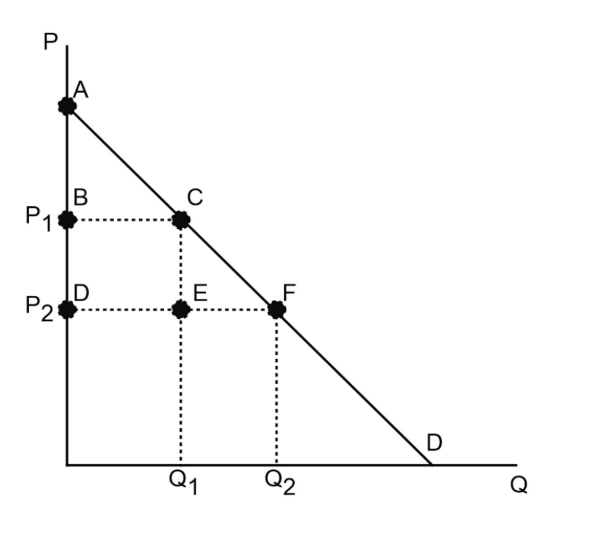
When the price is P1, consumer surplus is:
ABC
ADF
CEF
BCFD
ABC

When the price falls from P1 to P2, which area represents the part of the increase in consumer surplus that occurs due to the increased quantity purchased by consumers?
ABC
ADF
CEF
BCFD
CEF
Which of the following about demand is true?
The height of the demand curve for a product at a given quantity represents the marginal value (or marginal benefit) derived by the consumption of that unit.
The height of the demand curve for a product at a given quantity reflects the total value consumers derive from all units of the good consumed.
The total area below the demand curve for a product is equal to consumer surplus.
At every quantity, the height of the demand curve for a product represents the cost of producing that unit.
The height of the demand curve for a product at a given quantity represents the marginal value (or marginal benefit) derived by the consumption of that unit.

Refer to Table 3-1. If the table represents the willingness to pay of four buyers and the price of the product is $18, then their total consumer surplus is
$32
$42
$46
$72
$46
Consumer surplus is
The difference between what a consumer is willing to pay, and what the consumer actually pays (the price).
The area beneath the demand curve and above the price.
A measure of the pleasure consumers get from consuming goods and services, net of cost of obtaining those goods and services.
All of the above.
All of the above.

Which area represents producer surplus when the price is P1?
DEF
ABED
BEC
ACF
DEF
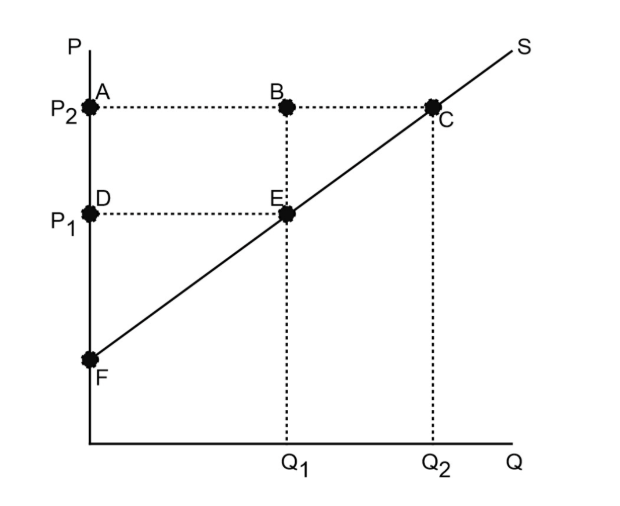
Suppose the price rises from P1 to P2. Which area represents the increase in producer surplus caused by selling the preexisting output Q1 at a higher price?
DEF
ABED
BEC
ACF
ABED
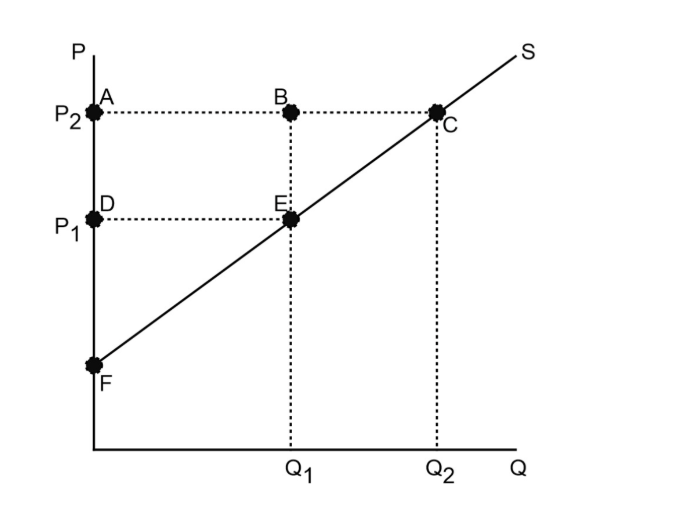
Suppose the price rises from P1 to P2. Which area represents the increase in producer surplus caused by selling additional output?
DEF
ABED
BEC
ACF
BEC
Robert's Hamburgers sells its 176th hamburger meal this week. Every hamburger meal sells for $11.45, and it costs Robert $8.05 to produce the meal. Robert's producer surplus is:
$8.05
$3.40
$11.45
$19.50
$3.40
Which of the following about supply is true?
The height of the supply curve represents the price at which the marginal unit of output is sold.
The height of the supply curve represents the marginal cost of producing the marginal unit of output.
Producer surplus is the area above the price and below the supply curve.
A profit-maximizing producer will produce every unit of output with a marginal cost greater than the price.
The height of the supply curve represents the marginal cost of producing the marginal unit of output.
Suppose you are willing to pay up to $80 for a new pair of shoes. You find a pair you like for $50 and buy them. The store that sold you those shoes would have been willing to sell them for as little as $45. Which of the following is correct?
You are $30 better of, and the store owner is $5 better off.
You are $5 better off, and the store owner is $30 better off.
You are $35 better off, and the store owner is not better off at all.
You are $30 worse off, and the store owner is $35 better off.
You are $30 better of, and the store owner is $5 better off.
Deadweight loss represents...
gains from trade that consumers and producers do not get when some voluntary exchanges do not occur
the sum of consumer and producer surplus in equilibrium.
loss of money due to regulation.
resources saved from being wasted in the production of low-value goods or services.
gains from trade that consumers and producers do not get when some voluntary exchanges do not occur
When economists say that market equilibrium is consistent with economic efficiency, they mean
the total gains from trade (the combined area of producer and consumer surplus) are larger than they could be at a different price and quantity.
all units that create more benefit than cost have been produced.
some units have been produced that cost more than benefits they create.
consumers and producers have made decisions without properly taking into account the market price.
all units that create more benefit than cost have been produced.

The deadweight loss of the tax illustrated in the figure above is given by the area:
GJL
FGLK
CEJI
ACIH
GJL

Use the figure above to match the letters from the different parts of the graph with the terms.
Tax per unit
Tax revenue collected by the government
Consumer surplus
Producer surplus
Deadweight loss
A- Tax per unit
B- Tax revenue collected by the government
C- Consumer surplus
E- Producer surplus
F- Deadweight loss
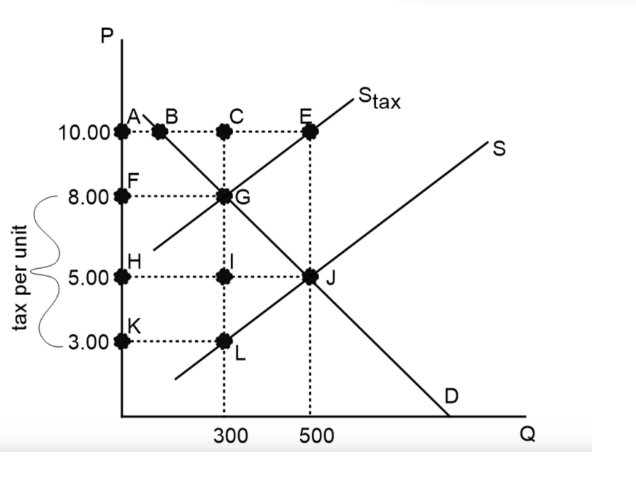
Tax revenue collected by the government in the figure above is:
Correct answer:
$1,500
$2,500
$900
$600
$1,500
If the government wants to raise tax revenue and shift most of the tax burden to the sellers, it would impose a tax on a good with a
flat (elastic) demand curve and a steep (inelastic) supply curve.
steep (inelastic) demand curve and a flat (elastic) supply curve.
steep (inelastic) demand curve and a steep (inelastic) supply curve.
flat (elastic) demand curve and a flat (elastic) supply curve.
flat (elastic) demand curve and a steep (inelastic) supply curve.
The government places a $0.50 per gallon tax on milk, paid by milk sellers. The burden of this tax falls...
on sellers.
on buyers.
equally on buyers and sellers.
There is not enough information to answer this question.
There is not enough information to answer this question.

Suppose a tax were imposed on each of the markets depicted below. For which market (A, B, C, or D) would the burden of the tax fall mostly on producers? Notice that I haven't even labeled supply and demand! You know which one is which, though --right?
A
B
C
D
C
If demand is more inelastic than supply, the burden of a tax will...
fall more heavily on consumers.
fall more heavily on producers.
fall equally on consumers and producers.
be determined by the legal assignment of the tax.
fall more heavily on consumers.