Designing Quality into Products and Services
 Call Kai
 Learn
Learn Practice Test
 Spaced Repetition
 Match
Match Flashcards
 Knowt Play
1/13

There's no tags or description
Looks like no tags are added yet.
Name | Mastery | Learn | Test | Matching | Spaced | Call with Kai | Chat |
|---|
No analytics yet
Send a link to your students to track their progress
14 Terms
3 Components to Designing Quality
Inputting customer’s voice into products design
Design optimization
design for reliability
Why is quality of design important?
Products and services must be well designed and highly reliable
Where do we start with designing products and services
Must start with input from the customer (their wants and needs)
Seven management tools
Affinity diagram
tree diagram
Process decision program chart (PDPC)
Matrix diagram
interrelationship digraph
prioritization matrix
activity network diagram
Designed to assist in the organization and communication of information
Affinity diagram
Designed to help organize large number of ideas and facts relating to a broad concept into categories
(Start with brainstorming, organize ideas into different categories)
Tree diagram
Tool to map out the paths and actions necessary to implement the ideas and objectives shown on the affinity diagram

Process Decision Program Chart (PDPC)
Provides a framework for developing contingency plans for preventing the unexpected or dealing with it if it does occur when moving from a problem statement to possible solutions
(Begins with a tree diagram, then considers all negative outcomes from each strategy branch) (Contingency plans are listed for each possible negative outcome to either prevent the deviation from occurring or to be in place if the deviation does occur)

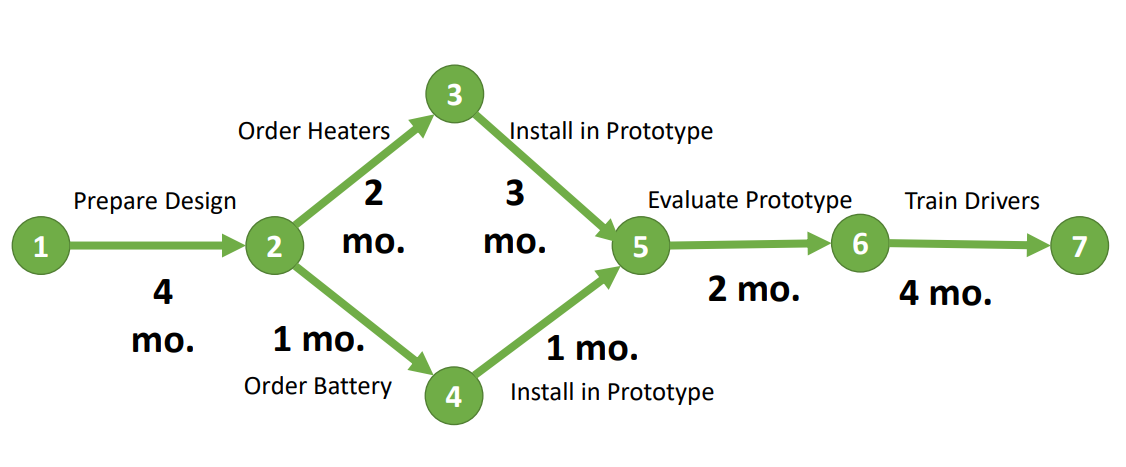
Activity Network Diagram
Project planning tool and a project control tool
Requires that the entire project can be broken down into its component activities, that the duration of each activity be forecast, and that the precedence relationship among the activities be defined
est. project duration (critical path) is determined by the length of the longest path through the network (one delay in any activity on the critical path will delay the entire project)
Interrelationship Diagraph
Graphically depicts causal relationships among the categories in an affinity diagram
Shows that every idea can be logically linked with more than one other idea at a time (lateral thinking rather than linear thinking)

Prioritization Matrix
Allows the comparison of both quantitative and qualitative data in the same analysis

Matrix Diagram
Graphically depicts relationships between concepts
Shows the relationship between the desired objectives and possible actions that could be taken

Customer’s implicit reqauirements
Customers expect certain basic features without saying so. If those features are missing, dissatisfaction increases.
Quality function deployment (QFD)
A systematic way to ensure that the customer’s definition of quality is considered during the product design process and throughout the production process
Four phase QFD process
House of Quality → Parts Planning → Process Planning → Production Planning
