Rutgers Parul Jain - Financial Management Midterm 1
 Call Kai
 Learn
Learn Practice Test
 Spaced Repetition
 Match
Match Flashcards
 Knowt Play
1/112

There's no tags or description
Looks like no tags are added yet.
Name | Mastery | Learn | Test | Matching | Spaced | Call with Kai | Chat |
|---|
No analytics yet
Send a link to your students to track their progress
113 Terms
Capital Budgeting
What long-term investments or projects should the business take on?
Capital Structure
- How should we pay for our assets and investments?
- Should we use debt or equity?
Working Capital Management
How do we manage day-to-day finances, short-term assets (inventory) and liabilities (accounts payable) of the firm?
Sole Proprietorship
business owned and operated by one person
- least regulated
- owner keeps all profits
- owner has unlimited liability for business debts
Partnership
A business in which two or more persons combine their assets and skills
- similar advantages to sole proprietorship
- unlimited liability for all partners
- can be general or limited
General Partnership
partnership in which partners share equally in both responsibility and liability
Limited Partnership
one or more general partners will run the business and have unlimited liability, but there will be one or more limited partners who will not actively participate in the business
Corporation
A business owned by stockholders who share in its profits but are not personally responsible for its debts
- stockholders and managers are separate
- profits are double taxed
- superior in raising money
- superior in transferring ownership
Goal of Financial Management
*Maximize the current value of the company's stock/value of owners equity
- Maximize profit
- Minimize costs
- Maximize market share
- Based on stockholders desires
The Sarbanes-Oxley Act of 2002
Regulates management greed and abuse; requires public companies to annually assess and report on the design and effectiveness of internal control over financial reporting.
Agency Relationship
Relationship between stockholders and management
- exists when the (principal) hires an (agent) to represent his or her interests
Agency Problem
Conflict of interest between principal and agent
Managerial Compensation
Incentives can be used to align management and stockholder interests
The incentives need to be structured carefully to make sure that they achieve their goal
Corporate Control
The threat of a takeover may result in better management
Stakeholders
Any person or entity other than a stockholder or creditor who potentially has a claim on the cash slows of a firm
Primary Market
The original sale of securities by governments and corporations
Secondary Market
Where securities are bought and sold after the original sale, between other investors
Auction Markets (Secondary Market)
- has a physical location
- match those who wish to sell with those who wish to buy
Dealer Market (Secondary Market)
- a market where dealers buy and sell for their own accounts
Securities and Exchange Commission (SEC)
- Public offerings of debt and equity must be registered with SEC
over-the-counter (OTC) market
Dealer markets in stocks and long-term debt
2 distinct groups that report to the chief financial officer
The treasurer's office and the controller's office
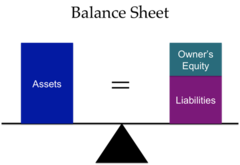
Balance Sheet
A financial statement that reports assets, liabilities, and owner's equity on a specific date.
current assets
items that can or will be converted into cash within one year
- Listed in decreasing liquidity
fixed assets
assets that will be held or used for a period longer than one year
tangible (fixed assets)
property, plant, and equipment
intangible (fixed assets)
patents and trademarks
Current Liabilities
liabilities due within a year, come before long-term liabilities
- Accounts Payable
long-term liabilities
obligations that a company expects to pay after one year
- debt due after one year
bond and bondholder
long-term debt and long-term creditors
Net Working Capital
current assets - current liabilities
Liquidity
the ease with which an asset can be converted into cash
financial leverage
the use of debt in a firm's capital structure
-increases the potential reward, but also increases potential for distress and failure
Book Value
Values shown on the Balance Sheet, generally not what the assets are actually worth
GAAP (Generally Accepted Accounting Principles)
audited financial statements in US mostly show assets at historical costs (Book Value)
Market Value
the amount for which something can be sold on a given market.
Income Statement
Summarizes a firms revenue and expenses over a period of time.
Revenues - Expenses = Income
Dividends
earnings distributed to stockholders, counts as an expense
Earnings Per Share (EPS)
net income/shares outstanding
recognition or realization principle
revenue can only be recognized once the underlying goods or services associated with the revenue have been delivered
Matching Principle
recognize expenses in the same period as the revenues they help to generate
Accounting income vs cash flow
Accounting Income statement contains noncash items like depreciation
noncash items
expenses charged against revenues that do not directly affect cash flow, such as depreciation
Accountants classify costs as:
Product Costs and Period Costs
Product Costs
direct materials, direct labor, manufacturing overhead
- (Cost of Goods Sold)
- fixed and variable
Period Costs
all the costs that are not product costs.
- selling, general and administrative
-variable and fixed
- Ex. Salaries
average tax rate
total tax bill divided by total taxable income
- all marginal tax brackets added together
marginal tax rate
tax rate that applies to the next dollar of taxable income
- Income in the tax bracket (75,000 - 50,000) multiplied by tax rate of that bracket (.25)

flat-rate tax (US System)
income tax rate stays the same, regardless of taxable income
- marginal is always same as average
tax inversion
US based company merges with oversees company to avoid paying US taxes
Tax Cuts and Jobs Act of 2017
Sets US taxes as a flat-rate 21%
Cash Flow Statement
difference between the flow of money in and out of the business.
Cash flow from assets = Cash flow to creditors + Cash flow to stockholders
Cash flow from assets
operating cash flow - net capital spending - change in net working capital
Operating Cash Flow (OCF)
cash generated from a firm's normal business operating activities
EBIT + Depreciation - Taxes
- EBIT: Earnings before Taxes
- We add back depreciation because its a noncash expense
capital spending
money spent on fixed assets minus money received from sale of fixed assets
Ending Net Fixed Assets - Beginning net fixed Assets + Depreciation = Net Capital Spending
Change in Net Working Capital
Net change in current assets relative to current liabilities for the period being examined.
Ending NWC - Beginning NWC = Change in NWC
Accounting Operating cash flow
Different from normal OCF because: interest is deducted when net income is computed
- Interest is considered an operating expense rather than financial expense
cash flow from assets
The cash flow of a firm that is available for distribution to the firm's creditors and stockholders
Operating Cash Flow - Net capital spending - change in NWC
Free Cash Flow (FCF)
a.k.a cash flow from assets
- cash that the firm is free to distribute to creditors and stockholders
Cash flow to creditors (bondholders)
a firm's interest payments to creditors less net new borrowing
Cash flow to stockholders (owners)
dividends paid - net new equity raised
Sources of Cash
a firm's activities that generate cash
uses of cash
a firm's activities in which cash is spent
Statement of Cash Flows
a firm's financial statement that summarizes its sources and uses of cash over a specified period

common-size statement
A standardized financial statement presenting all items in percentage terms. Balance sheet items are shown as a percentage of assets and income statement items as a percentage of sales.
common-base year statement
a standardized financial statement presenting all items relative to a certain base year
Assets 2018/Assets 2017
Combined Common-Size and Base Year Assets = ((Common size 2018 - 2017) + Common Base)/2
Financial Ratios
ways of comparing and investigating the relationships between different pieces of financial information
-eliminates size problem
Short-Term Solvency Ratio
financial ratio for measuring a company's liquidity and its ability to pay bills over short run (Current Assets, Liabilities)
Current Ratio
current assets divided by current liabilities
- measure of short term liquidity
Quick Ratio
Since inventory is least liquid we omit it in acid test ration
(Current Assets - Inventory) / Current Liabilities
Cash Ratio
Interest for short term creditors
Cash / Current Liabilities
Net working capital to total assets
Net Working Capital / Total Assets
interval measure
How long can business keep running with dry cash inflow.
Current Assets/Average Daily Operating Costs
Total Debt Ratio
how much debt per dollar of assets
(Total Assets - Total Equity) / Total Assets
Debt to Equity Ratio
Total Debt/Total Equity
Equity Multiplier
Total Assets/Total Equity
Long-term debt ratio
long term debt / (long term debt + total equity)
Times Interest Earned
Measure of long term solvency, how well the company has its interest obligations covered
EBIT/ interest
Cash Coverage Ratio
How well can the company pay its obligations using all its cash including depreciation
(EBIT + Depreciation) / Interest
Inventory Turnover
The higher the ratio the more efficiently we are managing inventory
COGS/Average Inventory
Days' Sales in Inventory
Measures the average number of days that inventory is held by a company.
365 days / Inventory turnover.
Receivables Turnover
How fast we collect outstanding credit accounts
Sales / Accounts Receivable
Days' Sales in Receivables
The ratio tells how many days it takes to collect the average level of accounts receivable.
365 days / Accounts receivable turnover ratio.
NWC Turnover
ratio of sales to NWC. The ratio measures how much "work" a firm gets out of its working capital.
Sales/NWC
Fixed Asset Turnover
For every dollar in fixed assets how much we generate in sales.
Sales/Net Fixed Assets
Total Asset Turnover
For every dollar in assets how much we generate in sales.
Sales/Total Assets
Profit Margin Ratio
How much profit per dollar in sales
Net Income/Sales
Return on Assets (ROA)
Measures how profitably a company uses its assets.
Net income/total assets.
Return on Equity
For every dollar in equity how much we generated in profit.
How the stockholders fared during the year.
Net Income/Total Equity
EPS
Earnings per share
net income/shares outstanding
PE Ratio
How many more times the shares sell for more than earnings per
price per share/earnings per share
Market to Book Ratio
market value per share/book value per share
Enterprise Value (EV)
An estimate of the market value of the company's operating assets
Total market value of the stock + Book value of all liabilities - Cash
EBITDA ration
Enterprise Value / EBITDA
ROE
ROA x Equity Multiplier = ROA x (1 + Debt Equity ratio)
Profit Margin x Total Asset turnover x Equity multiplier
DuPont Identity
Breaking ROE into 3 parts: Profit margin, Total Asset turnover, Financial leverage or Equity multiplier
Why evaluate financial statements?
Internal Uses:
-Performance Evaluation
-Planning for the future
External Uses:
-creditors
-suppliers
-customers
-Stockholders
Benchmarking ratios
- Time Trend Analysis
- Peer Group Analysis
Financial Planning
formulates the way in which financial goals are to be achieved
- planning horizon
- level of aggregation
Elements of Financial Planning
Investment in new assets - determined by capital budgeting decisions
Degree of financial leverage - determined by capital structure decisions
Cash paid to shareholders - determined by dividend policy decisions
Liquidity requirements - determined by net working capital decisions