Lecture 11: Inference from a Normal Population
 Call Kai
 Learn
 Practice Test
 Spaced Repetition
 Match
 Flashcards
 Knowt Play
1/6

There's no tags or description
Looks like no tags are added yet.
7 Terms
What is Student’s t-distribution used for?
Student’s t-distribution is used to make inferences about a normally distributed population when the sample size is small and the population standard deviation (σ) is unknown.
What are the key properties of Student’s t-distribution?
Symmetric and bell-shaped, centred at zero.
Has fatter tails than the standard normal distribution (z-distribution). This accounts for the extra uncertainty of estimating the population standard deviation (σ) from a small sample.
Its shape depends on the degrees of freedom (df = n − 1).
As sample size (n), and thus the degrees of freedom increase, the t-distribution becomes taller, narrower, and increasingly resembles the standard normal distribution.

How can we estimate the true population mean (μ) using Student’s t-distribution?
Different random samples produce different estimates of the population mean (μ). Therefore, instead of relying on a single estimate, we calculate a confidence interval to provide a range of plausible values.
When σ is unknown, we use:

What is a one-sample t-test used for?
A one-sample t-test is used to determine whether a sample mean is significantly different from a known or hypothesized population mean (μ0).
What are the steps involved in conducting a one-sample t-test?
1) State your hypotheses:
Null hypothesis (H0): μ = μ0
Alternative hypothesis (HA): μ ≠ μ0
2) Check the assumptions:
Random, independent observations.
Normality: The population should be approximately normally distributed.
3) Calculate the test statistic:

4) Find the critical value:
Use the t-table with df = n − 1 and the chosen significance level (α).
5) Apply the decision rule:
For a two-tailed test:
If |t| ≥ t* → Reject H0
If |t| ≥ t* → Fail to reject H0
How does sample size affect standard error and statistical power?
The standard error of the sample mean is:

Larger sample size (n): Smaller standard error, greater precision, and greater statistical power to detect true differences.
Smaller sample size (n): Larger standard error, less precision, and lower statistical power, increasing the likelihood of a Type II error (failing to reject a false null hypothesis).
Why do we use the chi-squared distribution instead of the t-distribution when estimating population variance (σ2)?
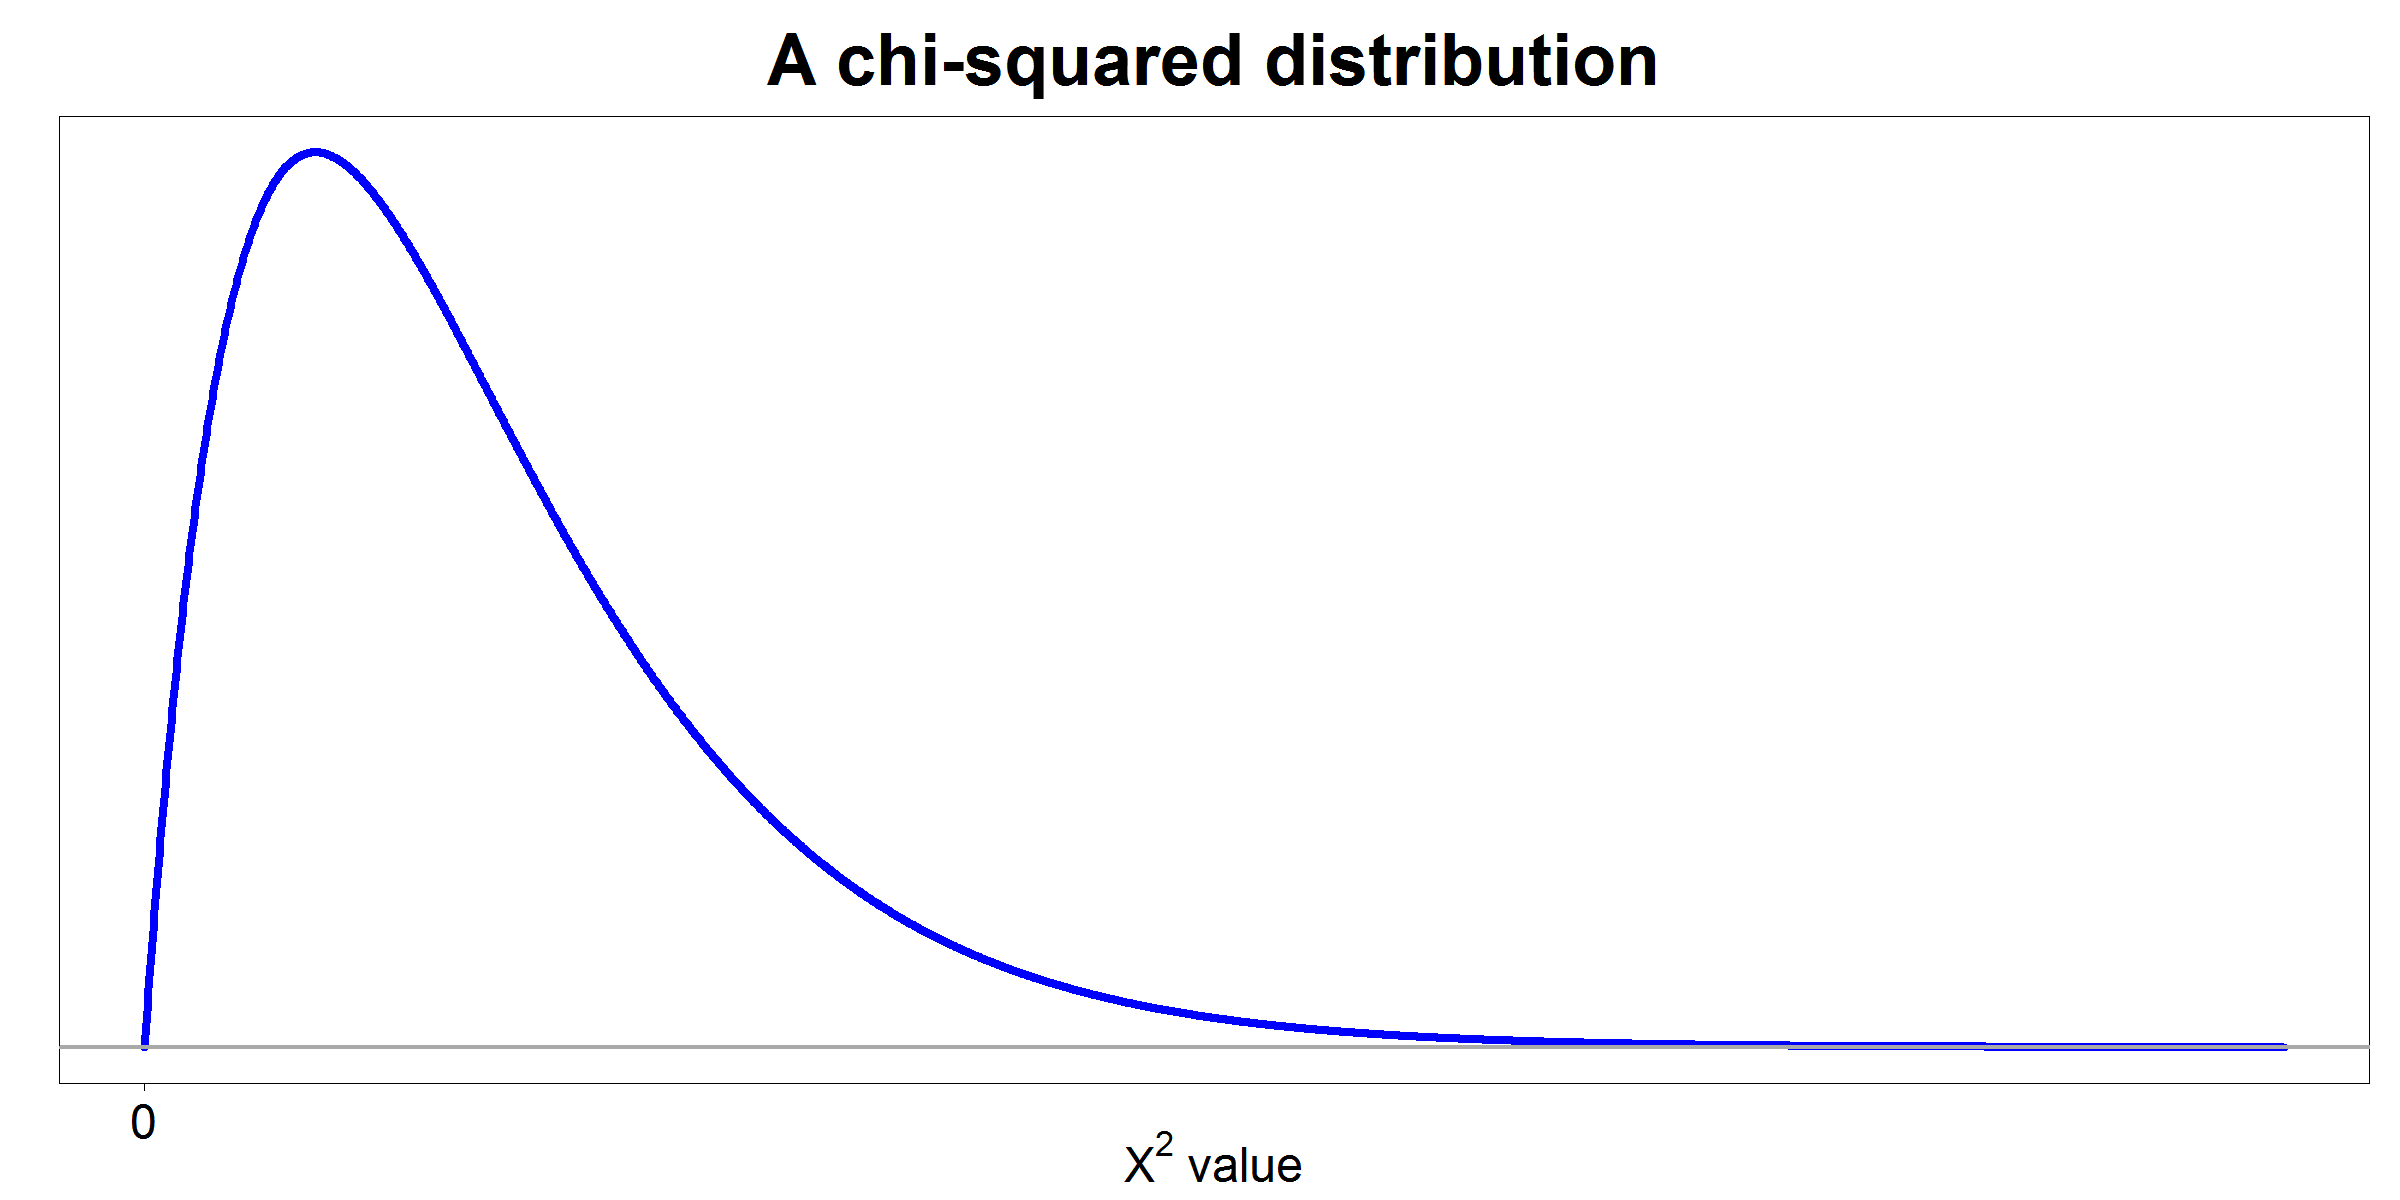
We use the chi-squared distribution because variance cannot be negative, and the chi-squared distribution starts at zero and extends toward positive values.
Its critical values are asymmetric, so both tails must be calculated separately.
We calculate a confidence interval to provide a range of plausible values likely to contain the true population variance (σ2) using the formula below: