Vertical Projectile Motion (24/02/26)
 Call Kai
 Learn
 Practice Test
 Spaced Repetition
 Match
 Flashcards
 Knowt Play
1/16

There's no tags or description
Looks like no tags are added yet.
17 Terms
what do position-time graphs tell us?
Where the object is located at any given time
what do velocity-time graphs tell us?
How the velocity (speed and direction) of an object changes over time
What does a straight line in a graph mean
A constant gradient (a constant rate of change)
what is the gradient of a velocity-time graph?
acceleration
what is the area of a velocity-time graph?
displacement
what is the area of a acceleration-time graph?
Change in velocity
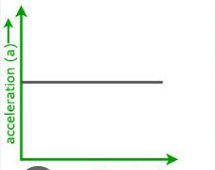
what is the shape of an acceleration-time graph?
horizontal line
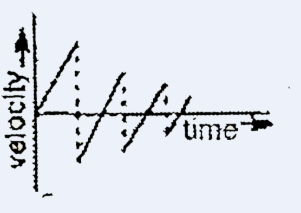
how does a bouncing ball graph look?
what calculation must you start with?
the one with the most information
what variable do you need for ‘when hit the ground’?
Final position: displacement (Δy or Δx) matches the height of the drop.
Final velocity (vf: usually what you need to calculate right before impact, or knowing that at maximum height, vf=0
if a long sum, what must you do?
write labels/headings for each step to easily follow
Why does an object go up before down?
The object has inertia and upwards velocity, which gravity gradually works against until velocity reaches zero at maximum height.
what does ‘velocity when lifted’ indicate?
use the Vi to max (graph)
what does ‘hit each othef’ indicate?
xA + (height/given height) = xB
Explain why velocity is less at A than at B?
Energy is lost due to the deformation of the [object] when colliding with the ground
What does making diwn positive look like on position time?
Draw under x axis and flipped, these graphs look like movement
Formula for simple s, d, t
v= x/t