RM-Correlation
 Call Kai
 Learn
 Practice Test
 Spaced Repetition
 Match
 Flashcards
 Knowt Play
1/15

There's no tags or description
Looks like no tags are added yet.
16 Terms
Describing correlation
-Measures relationship between 2 COVARIABLES (does not show cause and effect)
-Can be positive or negative
-Relationship can be strong or weak
-Can be represented on a scattergram (analysed using Spearman’s Pho or Pearson’s R and provides quantitative data)
Types of correlation
Positive and negative
Positive correlation
Covariable’s move in the same direction
Negative correlation
Covariable’s move in the opposite direction
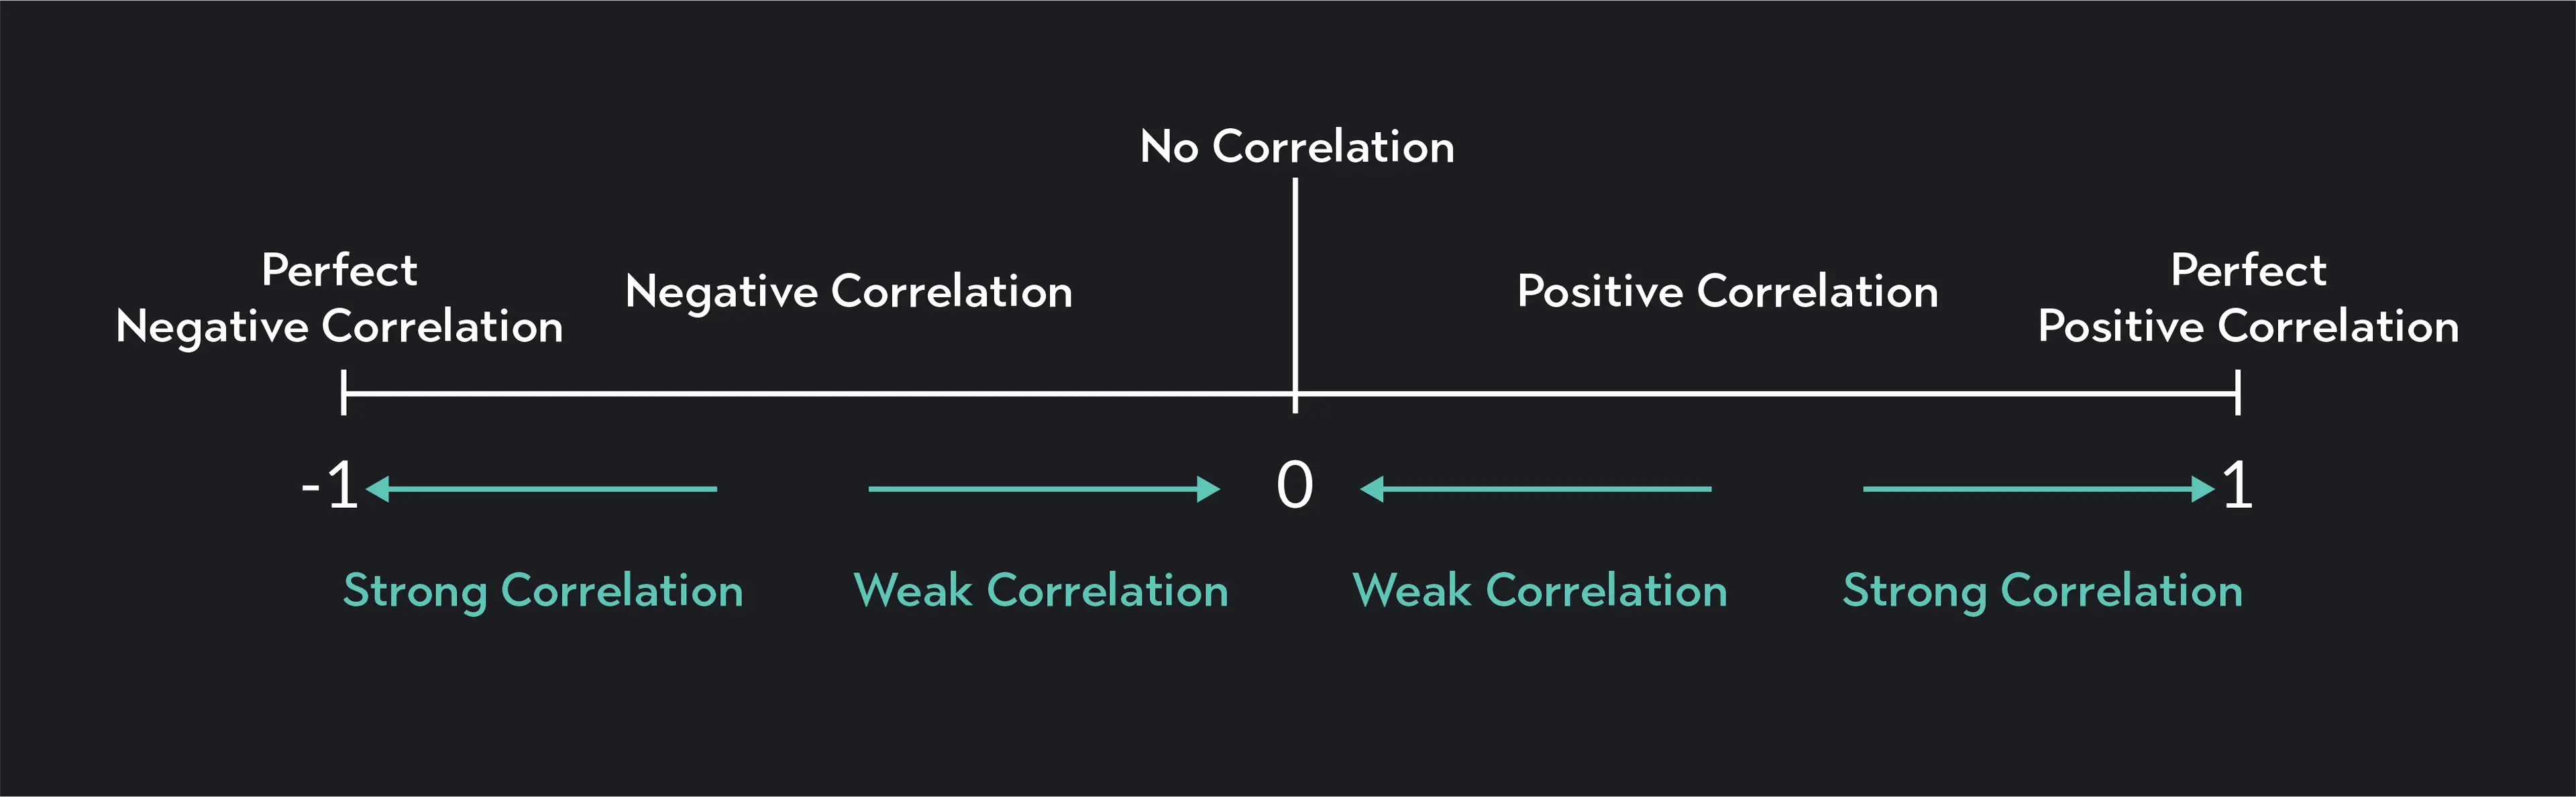
What is correlation coefficient (usually represented by r)
Number from -1 to +1 that indicates strength and direction of the relationship
Number- indicates strength (closer to -1/1 = variables are strongly related and more predictable)

Scattergrams
-One variable placed on the x axis and the other is placed on the y axis
-Show the correlational relationship between variables
Why can cause and effect not be established?
There may be a third variable/co founding variable that affects the variables
Writing a correlational hypothesis
-Dont use the word difference or effect
-Use the word correlation or relationship
-Dont use the word IV/DV, instead use 2 co-variables
-Operationalise the 2 co-variables
-Need quantitative data
Alternative directional hypothesis example
There will be a positive correlation between the number of hours of revisions completed by a student in one week and the % scores in the end topic test
Alternative non directional hypothesis example
There will be a correlation between the number of hours of revision completed by a student in one week and the % scores in the end topic test
Null hypothesis
There will be no relationship between the number of hours of revision completed by a student in one week and the % scores in the end topic test. Any relationship will be due to chance.
Difference between correlations and experiements
-Correlations have 2 co-variables whereas experiments as IV and DV’s
-Correlations examine if 2 co-variables are related to each other whereas experiments compare conditions to look for differences
-Correlations can only use scattergrams to display data whereas experiments can use other graphs
-Correlations record 2 pieces of data whereas experiments use experimental designs
Evaluations of correlations (strengths)
-Establishes a relationship when manipulation of the variables is not possible as it may be unethical or impractical
-Allows statistical analysis to be conducted in situations where experiments are not ethical or practical
-Scattergrams are easy to analyse when compared to case studies (data more complex and hard to interpret)
Evaluations of correlations (weaknesses)
-Does not establish cause and effect
Why do correlations not establish cause and effect
-Do not know which variable affects the other
-Lack of control of outside influences
-May be a coincidental relationship and not meaning
-Relationship may be caused by a third variable
Correlation coefficient strenghts
0–0.3 or 0-+0.3 weak correlation
-3–7 or +3-+7 moderate correlation
-0.7–1 or +0.7-+1 strong correlation