Asset Allocation
 Call Kai
 Learn
Learn Practice Test
 Spaced Repetition
 Match
Match Flashcards
 Knowt Play
1/75

There's no tags or description
Looks like no tags are added yet.
Name | Mastery | Learn | Test | Matching | Spaced | Call with Kai | Chat |
|---|
No analytics yet
Send a link to your students to track their progress
76 Terms
Framework for capital markets expectations
Specify the set of expectations needed including the time horizon to which they apply
Research the historical record
Specify the methods and/or models that will be used and their information requirements
Determine the best sources of information
Interpretation of current investment environment
Provide the set of expectations set out in Step 1
Monitor actual outcomes and compare with expectations

Challenges in developing capital market forecasts
Limitations of economic data
Data measurement errors and biases
The limitations of historical estimates
Ex-post risk can be a biased measure of ex-ante risk
Biases in analyst’s methods
The failure to account for conditioning information
Misinterpretation of correlation
Psychological Traps
Model Uncertainty
4) Ex-post risk can be a biased measure of ex-ante risk
may reflect a fear or concern that never materialized
returns would show the effect, but economic data would not
6) The failure to account for conditioning information
are there relevant new facts in the present when forecasting the future
Anchoring trap
initial impressions, data, or estimates - discuss anchor subsequent judgments
Status-quo trap
perpetuate recent observations
predict no change from the recent post
commit an error of omission rather than an error of commission
Overconfidence trap
overestimate the accuracy of forecasts
tending to believe that most people share our views
predicting to narrow a range of possibilities
Prudence trap
tendency to temper forecasts so that they do not appear extreme
Availability bias
tendency of forecasts to be - discuss overly influenced by events that have left a strong impression
a personal/vivid experience comes easily to mind, so you give it too much weight when assessing what could happen
Exogenous shocks
events from outside the economic system that affect its course
can be positive or negative for growth
typically not built into prices → unanticipated or only partially anticipated
policy changes, new tech, geo-politics, natural disasters, financial crisis etc
Approaches to economic forecasting
Econometric modelling
Economic indicators
Checklist approach
Checklist approach to economic forecasting
forecaster asks a series of questions about the economy (substantial amount of subjective judgment)
Business Cycle Phases
Initial recovery
early upswing
late upswing (contraction)
slowdown
recession
Initial Recovery (Business Cycle)
economy picks up from the slowdown/recession
business confidence rises, consumer confidence low
fiscal/monetary stimulus still present
typically matched by an inventory upswing CME effects/
gov't. yields start bottoming
Stocks rally sharply
cyclical assets & riskier assets outperform
Early upswing
confidence grows, economy gains momentum without inflation, unemployment starts to fall, business investment picks up
CME effects: short rates begin to move up, long rates stable
stocks → rising
Late upswing (contraction)
output gap closed, inflation looming, confidence high, unemployment low, wages grow
CME effects
interest rates rising
stocks rising but volatility increases
monetary policy may shift from neutral to hawkish
short-term interest rates, bond yield do too but less
yield curve steepens
Slowdown
economy slowing, business confidence dropping
inflation strong, downswing in inventory cycle
CME effects
short rates are topping out
bonds begin to rally → long bonds by more
yield curve often inverts
stock soft = falling
Recession
large inventory pullback, large drop in business investment, durable goods sales drop
consumer and business confidence decline
CME effects
short rates drop as do all bond yields
stocks drop & bottom before end of recession
Econometric modelling
quantitative modelling grounded in economic theory using only economic variables
(e.g. structural models reduced-form models)
one, or a system, of equations, estimated with OLS, used to forecast the future value of economic variables - exogenous variables supplied by forecaster
Economic indicators
economic statistics provided by government and private organizations that contain information on economy’s past (lagging), current (coincident) and future (leading) performance
YTM
YTM → PV(CF) = Po
It is the rate that would make all the present value of future cashflow equal to the current price
MacDur
MacDur = ModDur(1+YTM)
the weighted average time (in years) required for an investor to recover the price of a bond through its cash flows
Building Block Approach
one period default- free rate is
one period = forecast horizon (complicates term premium)
or/ (more commonly) return generated by rolling over the 30-day T-Bill over the forecast horizon (keeps the term premium clean)
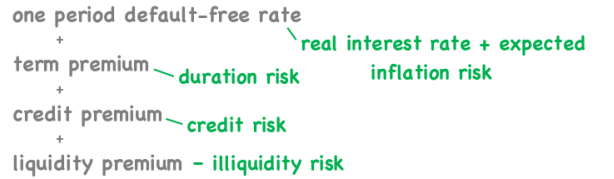
4 main drivers of term premium (maturity premium)
level-dependent inflation uncertainty - higher level of π (inflation rate), higher θ (inflation uncertainty
ability to hedge recession risk
good hedge against recession = low term premium
supply/demand of bonds at various maturities
cyclical effects - shape of the curve changes over the course of the business cycle .
Credit premium
Credit premium = expected loss + risk of default or credit migration
Conclusion: credit spreads driven primarily by credit premium + financial market conditions, but only secondarily by expected level of default
Liquidity premium
Liquidity for bonds are better when:
priced near par
relatively new
from a relatively large issuer
from a well known issuer
standard/simple structure
high quality
Forecasting equity returns
historical statistics approach
Discounted cash flow approach
risk premium approach
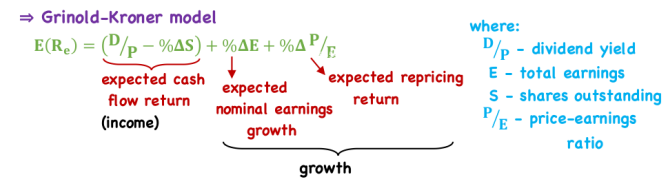
Grinold-Kroner Model
Gordon Growth Model (GGM)

Two risk premium approaches
ERP
equilibrium approach - (Singer & Terhaar)
Equity Risk Premium (ERP)
historical equity premiums are subject to substantial estimation error
ERP = historical equity returns - historical risk-free returns
Equilibrium approach (singer & Terhaar)

Real estate risk premium
Term premium + credit premium + equity risk premium + liquidity premium
Risk premium should be between corporate bonds and equity
Term premium: long-lived asset, very sensitive to level of long-term rates, therefore high term premium
Credit premium: exposed to the credit risk of tenants, lease → bond-like cash flows, therefore credit premium commensurate with the average tenant credit risk
Equity risk premium: relative to corporate debt, owner bears full risk of fluctuations in property value, (+ uncertainty in rent growth, occupancy etc)

Real estate in an equilibrium framework
unsmoothed data series
equilibrium models assume fully liquid assets, therefore add a liquidity premium
far less integrated (.50-.75), more closely related to local economic factors
Exchange rate influences
trade flows
purchasing power parity
competitiveness and sustainability of the current account
Expected percentage change in the exchange rate
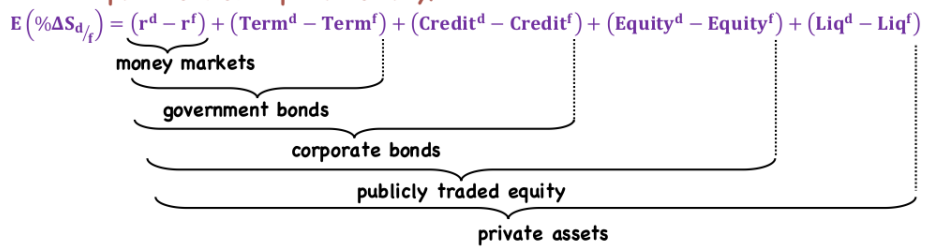
Forecasting volatility methods
Sample statistics
VCV-matrix from multi-factor models
Shrinkage estimation of VCV-matrices
Estimating volatility from smoothed returns
Time-varying volatility: ARCH models
VCV = Variance-Covariance Matrix
Sample statistics
estimating a constant VCV-matrix
computed from historical return data
with small sample periods, cannot be used to estimate VCV-matrix for large number of assets
subject to substantial sampling error given typical small sample sizes
VCV-matrix from multi-factor models
Number of assets can be very large when exposures are to a small number of common factors
will contain less estimation error than using small historical samples
will also improve cross-sectional consistency
will handle a large number of assets
BUT- factor models are rarely correctly specified, therefore VCV-matrix will be biased and inconsistent

Shrinkage estimation of VCV-matrices

Estimating volatility from smoothed returns
Ex: real estate, private equity, hedge funds
smoothed returns dampen volatility, distort correlation\

Traded REITs correlation with equity (short vs long-run)
Highly correlated in the short-run less correlated in the long-run
Real estate expected return (long-run)

Real estate expected return (short-run)
g = growth in NOI, NOI/p = cap rate

Metrics for investing in emerging market debt
Fiscal deficit/GDP: < 4%
Debt/GDP: < 70%
Current account deficit/GDP: < 4%
FX reserves / short-term debt: > 100%
3 levels of governance structure
governing investment committee
investment staff
third-party resources
6 common elements of effective governance
articulate the long and short-term objectives of the investment program
Allocate decision rights and responsibilities among the functional units in the governance hierarchy effectively
Specify the process for developing and approving the investment policy statement
Specify processes for developing and approving the strategic asset allocation
Establish a reporting framework to monitor the programs progress towards the agreed don goals and objectives
periodically undertake a governance audit
Specify the process for developing and approving the investment policy statement features
Statement of investment objectives
Investment constraints
Duties and responsibilities
investment committee
Investment staff
3rd party providers
Investment guidelines
Reporting
Extended portfolio assets and liabilities
human capital
PV of pension income
PV of expected inheritance
PV of future consumption

3 broad approaches to asset allocation
Asset-only
focus solely on the asset side of the investor’s balance sheet
Liability-relative
choose an asset allocation in relation to the objective of funding liabilities
Goals-based
used primarily for individuals & families
Specify asset allocations for sub-portfolios, each of which is aligned to specified goals
3 super classes of assets
capital assets - an ongoing source of something of value
consumable/transformable assets - commodities
Store of value assets - currencies, gold, art
Criteria for specifying asset classes
assets within a class should be relatively homogenous
asset classes should be mutually exclusive
asset classes should be diversifying
asset class as a group should make up a preponderance of world investable wealth (large enough to be widely investable)
asset classes should have the capacity to absorb a meaningful proportion of an investor’s portfolio (liquidity and transaction costs)
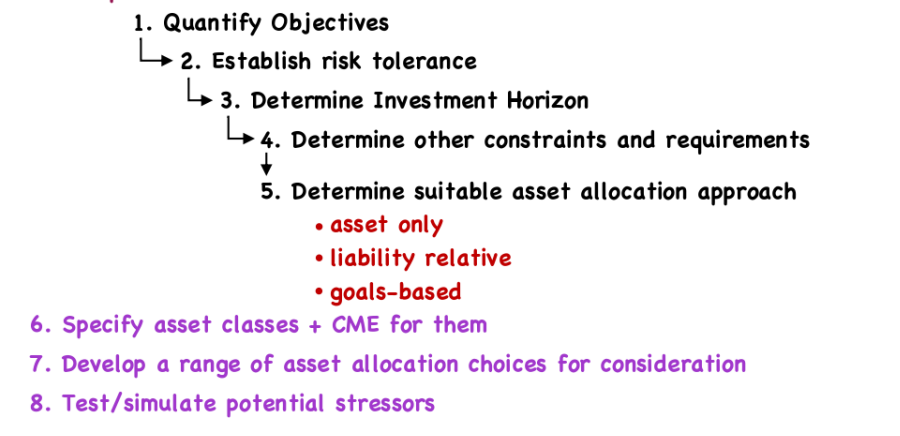
8 steps for asset allocation selection
Mean-variance optimization formula

Human capital (equity vs bond split)
Most human capital is 70% bond like and 30% capital like
Absolute contribution to risk (ACTR)
MCTR - marginal contribution to total risk

Liability relative asset-allocation approaches
Surplus optimization
Hedging/return seeking portfolio
Integrated asset-liability approach
Surplus optimization
an extension of mean variance optimization (MVO)
optimize over all assets and liabilities
institution is constrained to hold this ‘negative asset’
outcome optimizes over asset surplus

Hedging/return seeking portfolio
two-portfolio approach most appropriate for conservative investors or when the size of the PVL is large in relation to the size of the firm
Basic - surplus available
hedging portfolio
return seeking portfolio
Variants - deficit
partial hedged portfolio
return seeking portfolio
Integrated asset-liability approach
when decisions regarding the composition of liabilities must be made in conjunction with the asset allocation decision
e.g./capital-adequacy ratios
often implemented in the context of multi-period models
decisions about asset allocation will affect the amount of business
loans a bank can make, policies an insurance company can underwrite
Pension funding ratio

After-tax return formula (interest and equity)

After-tax standard dev
Taxes hurt gains and help losses therefore reduce the standard dev on expected return

Tactical Asset Allocation (TAA)
business or monetary cycle opportunities
temporary price dislocations
objective → increase risk-adjusted return by taking advantage of short-term market conditions
predicated on the belief that some short-term returns are predictable
Discretionary TAA
based on manager skill in predicting & timing short-term market moves
Systematic TAA
based on technical analysis/market signals
look for asset class level return anomalies
(value, momentum, valuation, trend-following)
Loss Aversion - Behavioural Bias
may interfere with an investor’s LOS e ability to maintain the SAA through - identify periods of negative returns
People feel the pain of a loss more strongly than the pleasure from an equivalent gain, This can cause investors to hold losing investments too long because they don't want to realize the loss, while potentially selling winners too early.
Illusion of Control
believing you have more influence over outcomes than you actually do
may result in:
extreme TAA (all in/all out market calls)
belief in superior resources (institutional investors)
excessive trading, use of leverage
eliminating/shorting asset classes
Mental accounting
treating money differently depending on the mental “bucket” you put it in, even though money is fungible.
goals-based investing incorporates this bias into the process
Representative Bias
Seeing a pattern/recent trend and assume it is representative of what will happen going forward.
ex: this company looks like the next Apple, so it will probably be hugely successful
Equities have recently done well so they will continue to
TAA particularly susceptible to this bias (e.g. return chasing)
Framing Bias
choice of asset allocation may be influenced merely by the manner in which the risk-to-return trade-off is presented
Availability Bias
giving more weight to information that is familiar or easily recalled
Ex home bias, investing more in your own countries economy
Grinold-Kroner model (long-term)

Taylor Rule

Nominal GDP growth
Nominal GDP growth = Forecasted increase in labor input + Forecasted increase in labor productivity + Forecasted inflation
Monte Carlo Simulation
potential future outcomes
likelihood of meeting various goals
distribution of the portfolio’s expected value through time
potential maximum drawdowns
the effects of trading/rebalancing costs & taxes
Criticisms:
outputs highly sensitive to small changes in the inputs
the asset allocations tend to be highly concentrated in a subset of the available asset