Week 11 Momentum Indicators and Trading Strategies
 Call Kai
 Learn
 Practice Test
 Spaced Repetition
 Match
 Flashcards
 Knowt Play
1/20

There's no tags or description
Looks like no tags are added yet.
21 Terms
Momentum
The speed and persistence of a price move, assets that have been rising for a while tend to keep rising and falling assets tens to keep falling.
Rate Of Change
Price t - Price t-n / Price t-n x100
What indicator is momentum?
Leading - it changes BEFORE price
Two flavours
Time series - buy the stock if it is above where it was
Cross-sectional - buy the stock that rose the most over the last 3 to 12 months
Momentum
Pt - Pt-n
Momentum Rising , Flat, Falling, Negative (think like acceleration)
Momentum rising means the uptrend is accelerating
Momentum flat means the price is still rising but not any faster than n days ago
Momentum decreasing, uptrend is intact but decelerating
Momentum negative, price is now lower than n days ago
Momentum is
Price today - Price n days ago
Time series momentum
Past returns are positively autocorrelated with itself
Why does momentum exist; Chans four reasons
Slow diffusion of information : news is analysed and accepted gradually
Forced buying and selling by funds ,spread over days
Roll returns in future (persistent contango or backwardation)
High frequency traders reacting to order flow
Slow diffusion of information
Contrary to the efficient market hypothesis market participants do not get exchange and react to news simultaneously , eg when a cb shifts policy the high frequency traders will act first VERY QUICKLY followed by institutional investors followed by the retail investors who could take up to days to shift their portfolio. Prices drift in a steady trend rather than all at once.
Market Manipulation (momentum ignition or stop hunting)
Because people tend to cluster their orders around obvious chart levels (like round numbers or daily highs and lows) these high frequency traders can often approximate where a pocket of forced buying or selling is waiting. The high frequency traders usually short sell - so they sell borrowed shares at a price they think will trigger the orders
Roll Returns
Backwardation is a positive roll return , spot price is higher than the future contract price, usually due to immediate supply shortages or high demand.
Contango is a negative roll return - future price is higher than the spot price, often caused by an abundant supply and high storage or insurance costs. Selling the cheaper contract to buy a more expensive one locks in a steady loss.
Forced buying and selling
Large funds are forced to mechanically buy or sell regardless of price - they must spread those massive trades across multiple days
Volume
Measures a trend - tells you how much conviction is behind a move
SMA

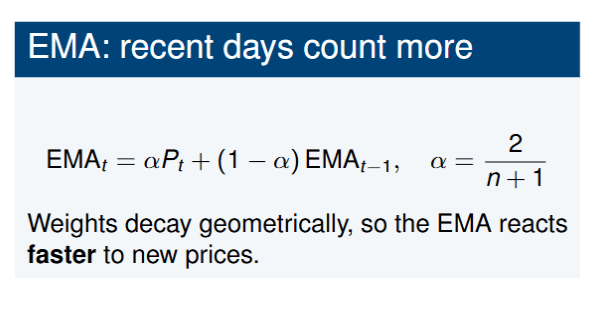
Exponential Moving Average
Golden Cross
Bullish Signal - short term moving average crosses above a longer term MA
Typically the 50 and 200 day MA
Obviously 50 ma is more sensitive to changes in the market
Death Cross
Bearish Signal - Longer term MA overtakes the Shorter term
Relative strength Index RSI
Measures the speed and size of recent gains relatuve to recen losses
On a scale of 0 to 100
RSI formula
RS = Avg gains over n days/ recent gains over n days RSI = 100 - (100/1+RS)