L4 Data Driven Techniques for energy landscapes
 Call Kai
 Learn
 Practice Test
 Spaced Repetition
 Match
 Flashcards
 Knowt Play
1/32

There's no tags or description
Looks like no tags are added yet.
33 Terms
PES ab initio methods

PES semi-empirical methods

Evolution of data driven approches

What are data driven techniques

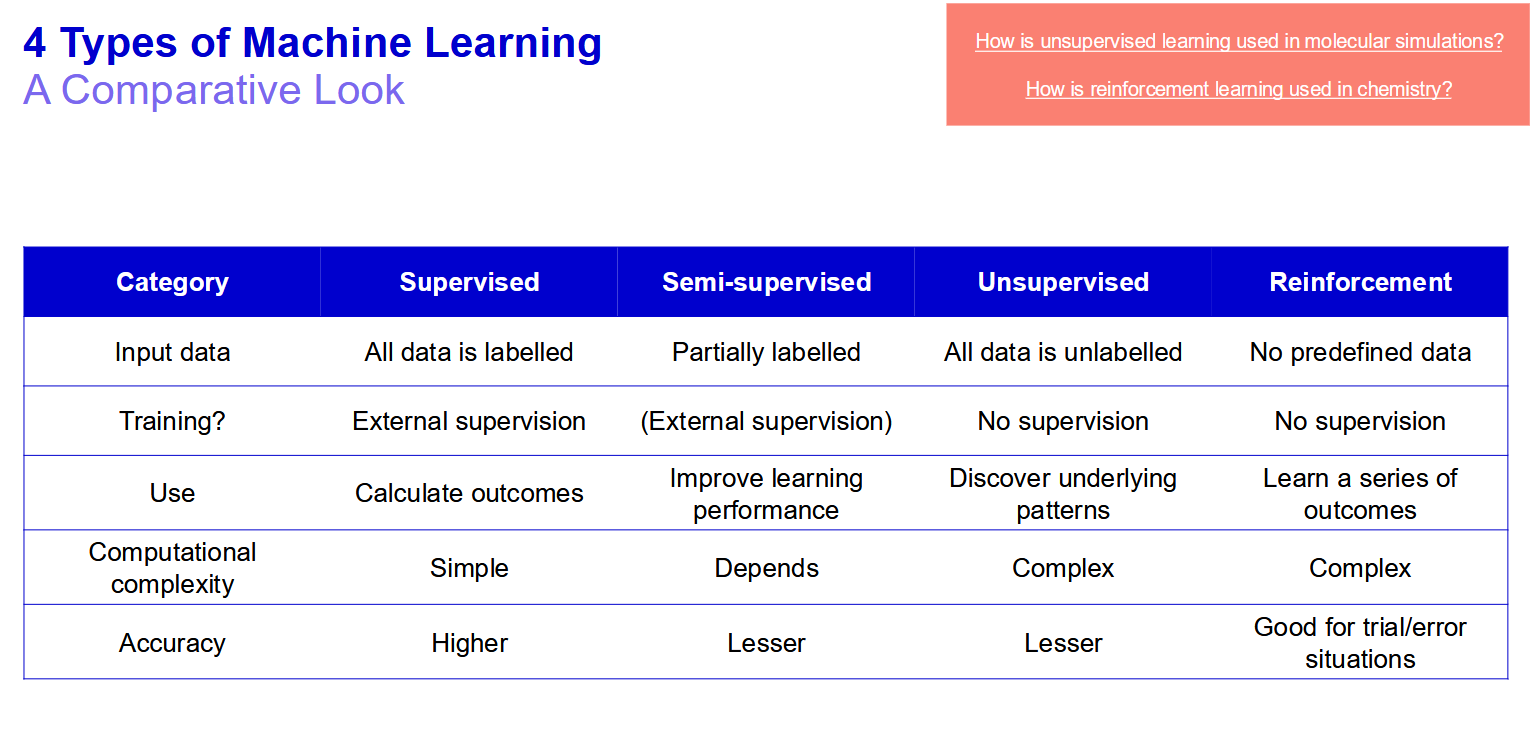
4 types of machine learning
Dimensionality reduction and clustering - simplifying and grouping data

Samples and variables

PCA (dimensionality reduction method) step 1 - calculate means for each variable

PCA steps 2 and 3, centring the data on the mean
It is important to divide by SD to ensure one variable is not assigned more value than another arbitrarily

PCA: finding a line of best fit using Pythagoras

PCA: finding a line of best fit by maximising distance from a projected point on a line to the origin

Principal component 1 and eigenvalues
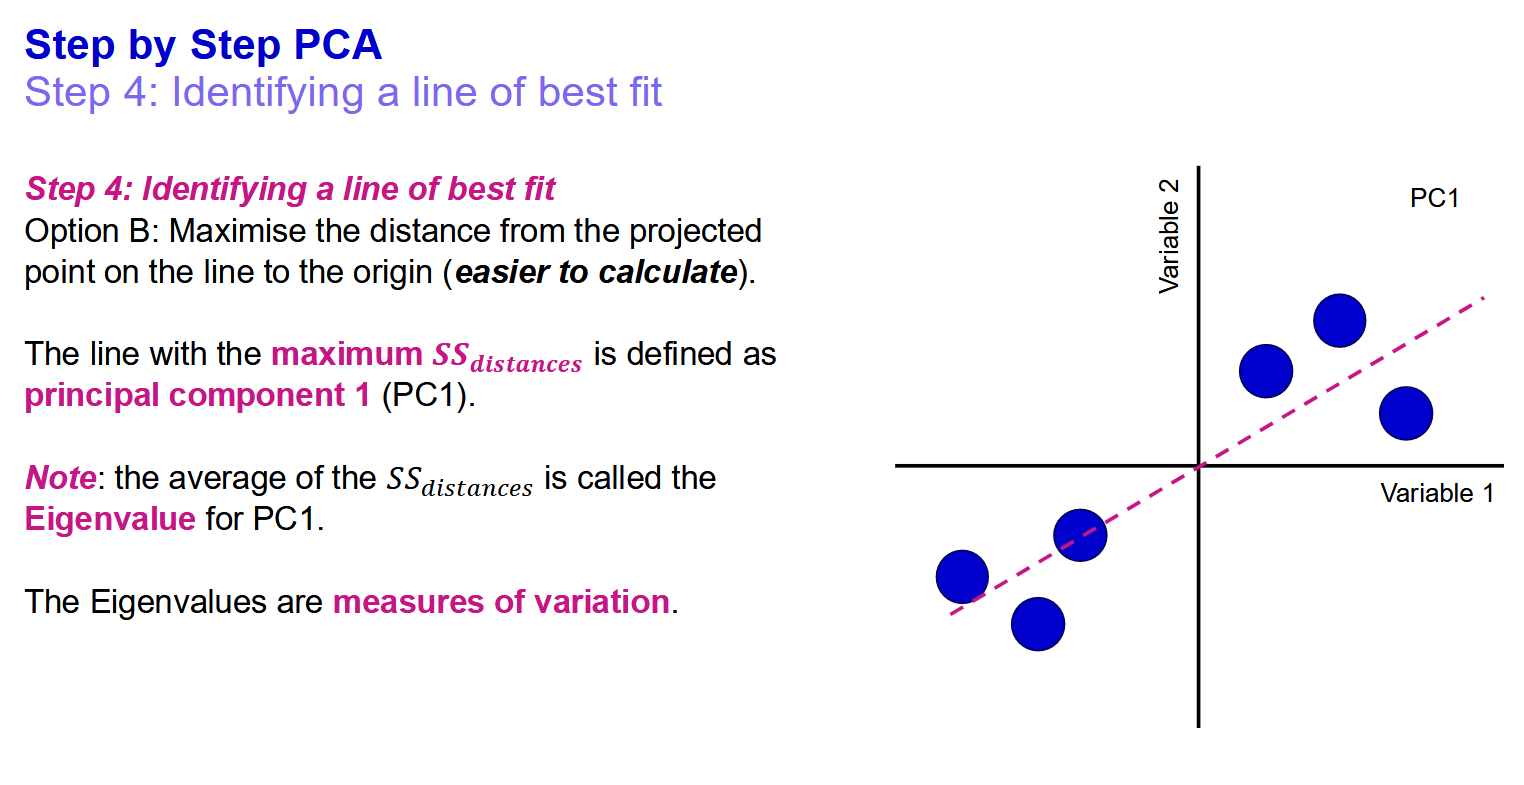
What does this line of best fit tell us in terms of the variation of variable 1 vs 2 along this PC

Finding PC2
Simple in 2D of course

Drawing the PCA plot

Comparing eigenvalues between PCs and Scree plots

PCA for 3+ variables

Eigenvalues and Scree plots with 3+ variables
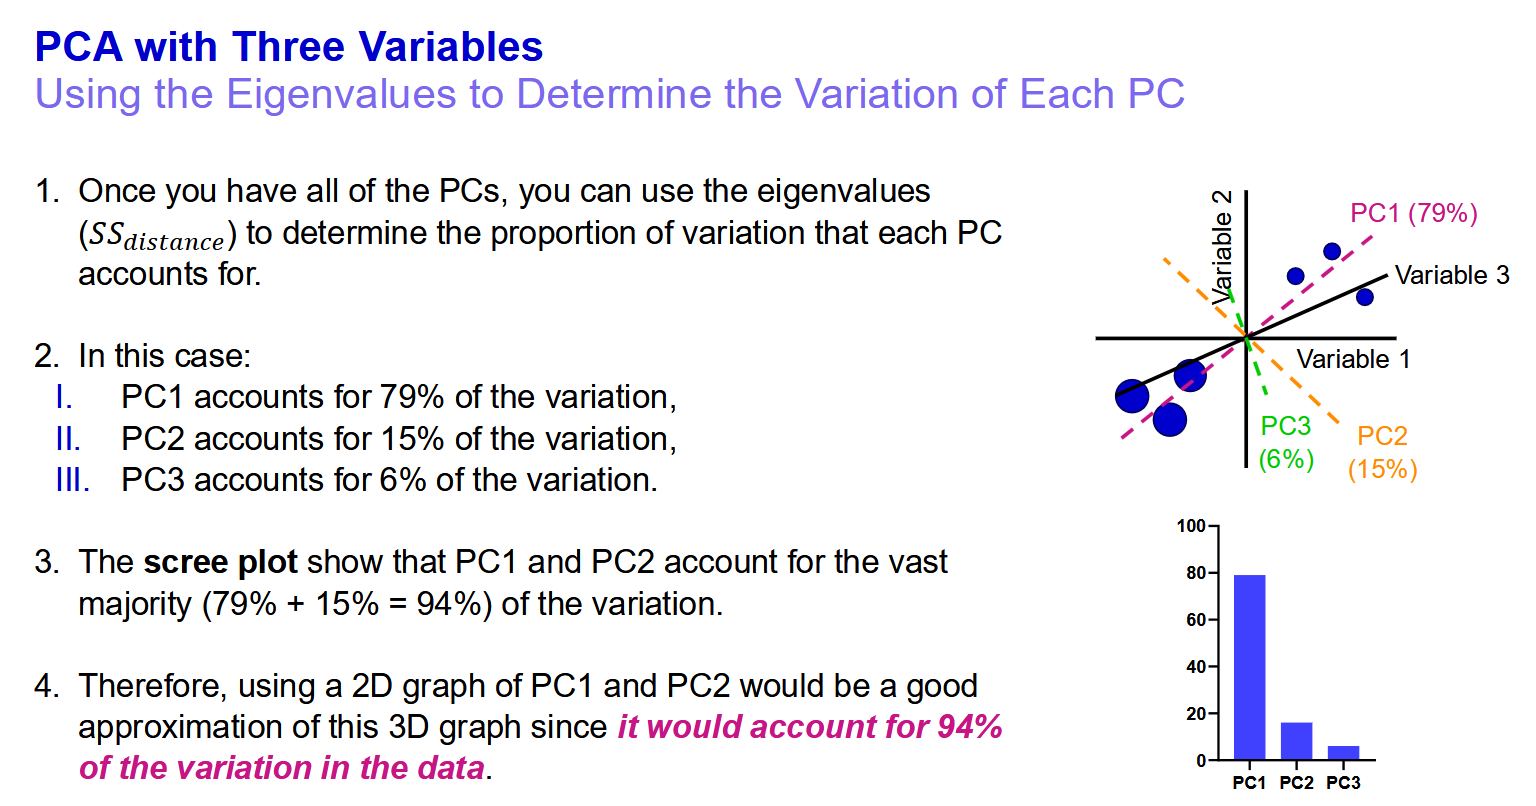
When is plotting just PC1 and PC2 not such a good idea
when they don’t account for an overwhelming majority of the variation

Linear vs non-linear projections for dimensionality reduction

k-means clustering

k-means clustering 1 and 2 - selecting no. of clusters and initialising k-centroids

Steps 3/4/5 - measuring distances to clusters, assigning points and repeating

Step 6/7 - finding the means of each cluster and iterating

k-means clustering vs doing it by eye

How do you assess clustering quality

How do you determine which clustering to keep

Using different values of k

What is the elbow plot and what do you use it for
determining the ideal number of clusters

k-means clustering in 2D

Limitations of k-means clustering

Alternative Clustering Techniques

UMAP clustering to model protein dynamics
