Statistics Practice Exam 1
 Call Kai
 Learn
Learn Practice Test
 Spaced Repetition
 Match
Match Flashcards
 Knowt Play
1/26

There's no tags or description
Looks like no tags are added yet.
Name | Mastery | Learn | Test | Matching | Spaced | Call with Kai | Chat |
|---|
No analytics yet
Send a link to your students to track their progress
27 Terms
A group of 100 students was surveyed about their interest in a new international studies program. Interest was measured in terms of high, medium, or low. In the study, 30 students responded high interest, 40 students responded medium interest, and 30 students responded low interest. What is the relative frequency of the students with high interest?
0.30
Income is a variable often used in business and economics. Income is an example of a variable that uses the
Ratio scale

A Human Resource manager at Metal Technologies studied the overtime hours of welders. A sample of 15 welders showed the following number of overtime hours worked last month. Give the Arithmetic mean and Indicate whether it is a statistic or a parameter.
10.73 ; Statistic
T/F: To convert a frequency distribution to a relative frequency distribution, divide each class frequency by the number of classes.
False
T/F: Data measured on a nominal scale can only be classified into categories.
True
T/F: Extremely high or low scores affect the value of the median.
False

What is the relative class frequency for the $25 up to $35 class?
0.06
T/F: For a set of data arranged or sorted in numerical order, the value of the observation in the center is called the weighted mean.
False
What is the relationship among the mean, median, and mode in a symmetric distribution?
They are all equal
In June, an investor purchased 275 shares in Oracle company stock at $120 per share. In August, she purchased an additional 370 shares at $140 per share. In November, she purchased an additional 370 shares at $190. What is the weighted mean per share?
152.81
T/F: For any distribution, there is an equal number of values above and below the mean.
False

Listed here is the percent increase in sales for the MG Corporation over the last 5 years. Determine the geometric mean percent increase in sales over the period.
12.28%
A disadvantage of using an arithmetic mean to summarize a set of data is that the arithmetic mean _______.
Can be biased by one or two extremely small or large values
The Consumer Price Index is reported monthly by the US Bureau of Labor Statistics. It reports the change in prices for a market basket of goods from one period to another. The index for 1998 was 166.5. By 2015, it increased to 286.6. What was the geometric mean annual increase for the period?
3.25%

What is the class interval?
$200
According to Chebyshev’s theorem, at least what percent of any set of observations will be within 18 standard deviations of the mean?
69%

A sample of 25 undergraduates reported the following dollar amounts of entertainment expenses last year. Find the mean, median and mode of this information. What are the range and standard deviation. Use the empirical rule to establish an interval that includes about 95% of the observations.
Mean = 728.44 ; Median = 720 ; Mode = 719 ; Range = 89
Assume a student received the following grades for the semester. History B, Statistics A, Spanish C, and English C. History and English are 7 credit hour courses, Statistics is a 8 credit hour course, and Spanish is a 3 credit hour course. If 4 grade points are assigned for an A, 3 for B, and 2 for a C. What is the weighted mean grade for the semester?
2.92

The manager of the Bilo Supermarket in Mt. Pleasant, Rhode Island gathered the following information on the number of times a customer visits the store during a month. The responses of 51 customers are pictures. Starting with 0 as the lower limit of the first class and using a class interval of 3, organize the data into a frequency distribution. Where do the data tend to cluster? Convert the distribution to a relative frequency distribution.
For a data set, half of the observations are always greater than the ______.
Median

During the past six months, a purchasing agent placed the following orders for coal. What is the weighted arithmetic mean price per ton?
T/F: In a company, the standard deviation of the ages of female employers is 6 years and the standard deviation of the ages of male employers is 10 years. These statistics indicate that the dispersion of age is greater for females than for males.

A student was interested in the cigarette smoking habits of college students and collected data from an unbiased random sample of students. The data are summarized in the following table. What type of chart best represents the relative class frequencies?
The mean income of a group of sample observations is $500. The standard deviation is $40. According to Chebyshev’s theorem, at least what percent of the income will lie between $400 and $600.
T/F: The ordinal level of measurement is considered the “lowest” level of measurement.
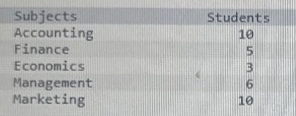
Identify whether the table given below is a frequency table or a frequency distribution.
The ages of sample of Canadian tourists flying from Toronto to Hong Kong were 23, 25, 67, 44, 50, 29, 77, 51, 25, and 40. Compute the range. Compute the standard deviation.