Thesis
 Call Kai
 Learn
 Practice Test
 Spaced Repetition
 Match
 Flashcards
 Knowt Play
1/28

There's no tags or description
Looks like no tags are added yet.
29 Terms
Image segmentation
Groups pixels that are close in proximity and have similar spectral features into a segment. The segments have certain shapes, spatial, and spectral characteristics that can be further grouped into objects
Random tree classification method
Collection of individual decision trees in which each tree is generated from different samples and subsets of training data. For every pixel that is classified, a number of decisions are made and ranked in order of importance. The dataset is classified a number of times based on a random subselection of training pixels, resulting in many decision trees. Each tree gets a vote before a final decision is made.
Normalized Difference Vegetation Index (NDVI)
Normalized ratio of reflectance values in the near-infrared and red spectral bands. Vegetation absorbs red light for photosynthesis and strongly reflects near infrared spectra. NDVI is a normalized index calculated from these characteristics, where positive values indicate foliage and negative values represent water or bare surfaces.

Supervised classification
Where you decide what class categories you want to assign pixels or segments to. These class categories are referred to as your classification schema. After the classification is complete, you will have to go through the resulting classified dataset and reassign any erroneous classes or class polygons to the proper class based on your schema.
Unsupervised classification
Where you let the computer decide which classes are present in your image based on statistical differences in the spectral characteristics of pixels.
Spectral detail (image segmentation)
Set the level of importance given to the spectral differences of features in your imagery. Valid values range from 1.0 to 20.0. A higher value is appropriate when you have features you want to classify separately but have somewhat similar spectral characteristics. For example, a higher spectral detail value in a forested scene will result in greater discrimination between the different tree species.
Spatial detail (image segmentation)
Set the level of importance given to the proximity between features in your imagery. Valid values range from 1 to 20. A higher value is appropriate for a scene where your features of interest are small and clustered together. Smaller values create spatially smoother outputs. For example, in an urban scene, you could classify impervious surface features using a smaller spatial detail value, or you could classify buildings and roads as separate classes using a higher spatial detail value.
sf package
manipulation of spatial data by using simple specifications (SFs) defined by the Open Geospatial Consortium (OGC) to read and write spatial data, perform geometric operations, and perform spatial compositing.
terra package
Methods for spatial data analysis with vector (points, lines, polygons) and raster (grid) data. Methods for vector data include geometric operations such as intersect and buffer. Raster methods include local, focal, global, zonal and geometric operations. The predict and interpolate methods facilitate the use of regression type (interpolation, machine learning) models for spatial prediction, including with satellite remote sensing data. Processing of very large files is supported.
Confusion matrix (accuracy assessment)
matrix that summarizes predictions versus actual truths. Rows represent actual classes and columns represent predicted classes.

Kappa Coefficient (Accuracy Assessment)
measures agreement between two categorical labelings—such as a classified land-cover map and ground-truth labels—after accounting for agreement that could occur merely by chance.
Producer accuracy (Accuracy Assessment)
Probability of a reference pixel being correctly classified. Asks: Of all reference samples that truly belong to class X, how many did the classifier correctly label as X?
Producer accuracy (Accuracy Assessment)
Probability that a pixel classified on the image actually represents that category on the ground. Asks: Of all map pixels or samples labelled as class X, how many really are class X in the reference data?
Coordinate reference system (CRS)
describes how coordinate numbers correspond to locations on Earth. A geographic CRS uses angular coordinates—typically longitude and latitude in degrees—whereas a projected CRS represents locations on a flat coordinate plane.
psi i
probability a species is present at site i.
pit
probability a species will be detected at site i at time t.
N
Total number surveyed units.
T
number of distinct sampling occasions
nt
number of sites a species was detected at time t.
n.
number of sites a species was detected at least once.I
f presence and detection are constant, what does the combined model of likelihood look like?
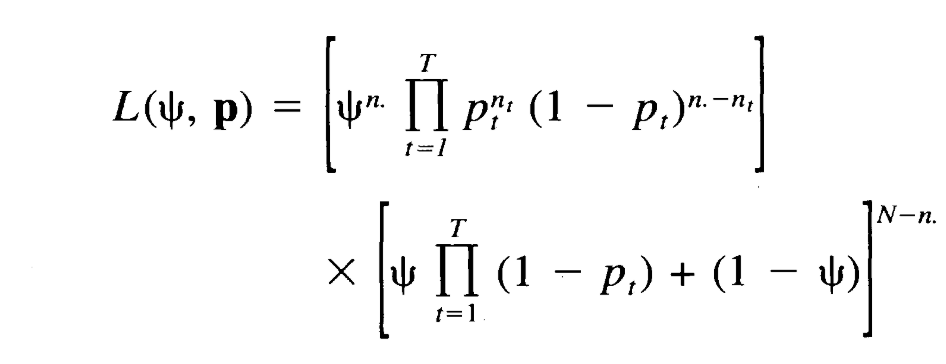
The standard error of psi is estimated using …
bootstrap method
Bootstrap method
a statistical technique for estimating quantities about a population by averaging estimates from multiple small data samples.
You start by taking a random sample of a population. From that sample you randomly sample n observations and repeat this many times.

Standard error
is a statistic that reveals how accurately sample data represents the whole population. It measures the accuracy with which a sample distribution represents a population. In statistics, a sample mean deviates from the actual mean of a population; this deviation is the standard error of the mean.
Covariates of an occupancy model can be added using a logistic model. What does the general function look like?
X = covariate information
B = vector of model parameter
0 = parameter of intrest

Akaike Information Criterion (AIC)
a statistical tool used to evaluate and compare the relative quality of different statistical or machine learning models on the same data set. It weighs goodness-of-fit (how well the model explains the data) against model complexity (the number of parameters), minimizing overfitting. AIC does not tell you if a model is "good" in an absolute sense; it only ranks candidate models relative to one another.
second-order modification of Akaike’s Information Criterion (AICc)
Same as AIC but used for small sample size relative to amount of parameters, which adds an extra penalty for small samples.
α^ (alpha-hat)
represents an estimated detection coefficient. It describes the change in the log-odds of detection for a one-unit increase in the canopy predictor, holding sampling period constant. If canopy was standardized, one unit means one standard deviation.
conditional model-averaged coefficient (GFOX)
modavg() averages the coefficient across models that contain that covariate, renormalizing their weights. Thus, the patch-density coefficient is averaged over the models containing patch_den, not over all 22 models with zeros assigned when patch density is absent. This differs from your prediction curves, which average predictions across the entire supplied model set. A model without patch density still contributes to that curve, but its prediction does not change as patch density changes.