(L11, 12) IMED2003 - Hypothesis Testing and Measures of Association
 Call Kai
 Learn
Learn Practice Test
 Spaced Repetition
 Match
Match Flashcards
 Knowt Play
1/74

There's no tags or description
Looks like no tags are added yet.
Name | Mastery | Learn | Test | Matching | Spaced | Call with Kai | Chat |
|---|
No analytics yet
Send a link to your students to track their progress
75 Terms
What are the five learning outcomes for hypothesis testing?
1. Describe and interpret hypothesis testing, including null and alternative hypotheses.
2. Describe, calculate and interpret inferential statistics, including standard error of the mean (SEM) and confidence intervals (CIs).
3. Understand and interpret Minimal Important Difference (MID).
4. Describe, interpret and identify Type I and Type II errors.
5. Describe and interpret statistical power.

What is the difference between a population and a sample, and why can repeated samples differ?
Population:
A group sharing one or more characteristics.
.
Sample:
A representative subset of a larger population.
.
Repeated samples from the same population can produce different means or medians because different individuals are sampled.
Lecturer example:
If different WA communities each sampled 100 people for social and emotional health research, or an outreach clinic sampled on Monday versus Wednesday, results could differ.
The slide notes that appropriate ethics approvals, informed consent and agreement with Traditional Owners would be required.

How do descriptive and inferential statistics differ?
Descriptive statistics:
Summarise the characteristics of the sample dataset, however in most cases we want to apply findings (generalise) to the entire population of interest.
.
Inferential statistics:
Use sample data to test hypotheses and provide evidence about the broader population to which researchers want to generalise.
.
Assumptions to consider include:
- Parametric-data assumptions.
- Whether the sample represents the population.
- Whether confounding variables are controlled.
How is the true population value related to a sample estimate?
True Population Value (Parameter) = Sample Value ± Error
.
Lecturer explanation:
Researchers usually cannot study the entire population, so the sample estimate is used to approximate the true population value while recognising sampling and other sources of error.
What is the difference between standard deviation (SD) and standard error of the mean (SEM)?
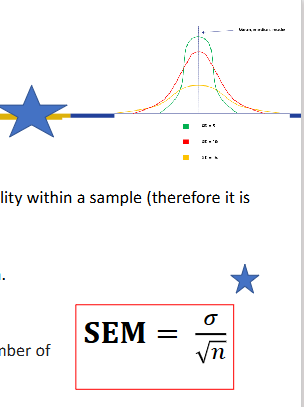
Standard deviation (SD; s or σ):
- Descriptive measure.
- Quantifies variability/spread within a sample.
- Commonly plotted when showing spread.
.
Standard error of the mean (SEM):
- Quantifies uncertainty in the estimate of the mean.
- Indicates how well the sample mean represents the population mean.
- Conceptually, it is the SD of the means from infinitely many repeated samples.

How is the standard error of the mean (SEM) calculated?
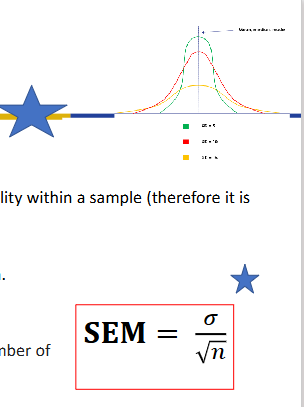
If population SD is known:
SEM = σ / √n
.
If population SD is unknown:
SEM is estimated using sample SD:
SEM = s / √n
Where:
σ = population SD
s = sample SD
n = sample size
Lecturer explanation:
Population SD is usually unknown in health research, so sample SD is commonly used, giving a less precise estimate.


What is a confidence interval (CI)?
A confidence interval is a range of values believed to encompass the actual or "true" population value.
It provides:
- Lower confidence limit.
- Point estimate.
- Upper confidence limit.
.
In health science, 95% confidence is commonly used.
Lecture wording:
"We are 95% confident the population mean lies within these limits."
There remains a 5% chance that the true value lies outside the limits; we can never be 100% certain.

How can a 95% confidence interval for a mean be calculated for a large sample?
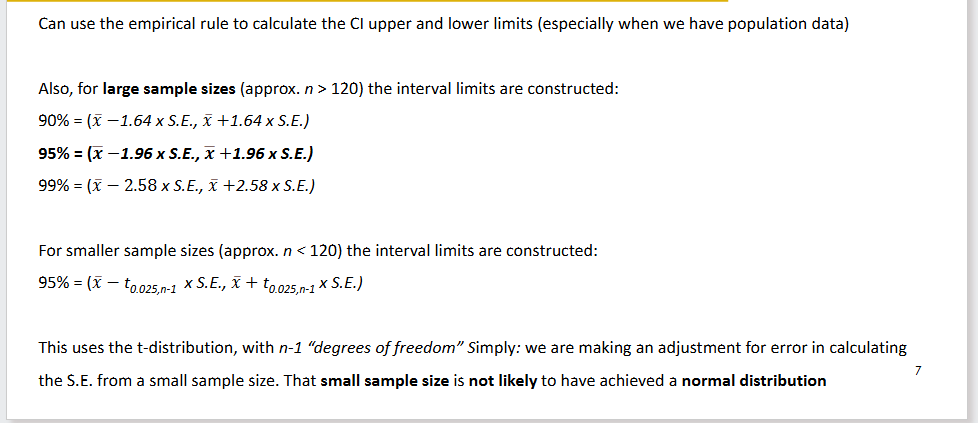
One method:
95% CI = mean ± 1.96 × SEM
More generally for large samples (approximately n > 120):
90% CI = x̄ ± 1.64 × SE
95% CI = x̄ ± 1.96 × SE
99% CI = x̄ ± 2.58 × SE

How is a 95% confidence interval adjusted for a smaller sample?
For approximately n < 120:
95% CI = x̄ ± t₀.₀₂₅,n−1 × SE
.
This uses:
- The t-distribution.
- n − 1 degrees of freedom.
Lecturer explanation:
The adjustment allows for greater error when estimating SE from a small sample that may not closely approximate a normal distribution.

What determines the width and precision of a confidence interval?
Narrower CI:
Greater precision in estimating the population mean.
.
Wider CI:
Less precision.
.
Larger sample size:
Generally increases precision and narrows the CI.
.
Higher confidence level:
Widens the CI.
.
For the same data:
90% CI is narrower than 99% CI.


How are confidence intervals used when comparing group means?
Researchers commonly present the mean difference relative to a control/standard/comparison group.
.
For a mean difference:
0 = no difference between groups.
.
If the CI for a treatment mean difference stays away from 0:
This supports a statistically significant difference.
.
If the CI includes/crosses 0:
A true difference of zero remains plausible.
.
Green is statistically significant compared to orange (for green there is no statistical difference, for orange there is complete statistical difference)


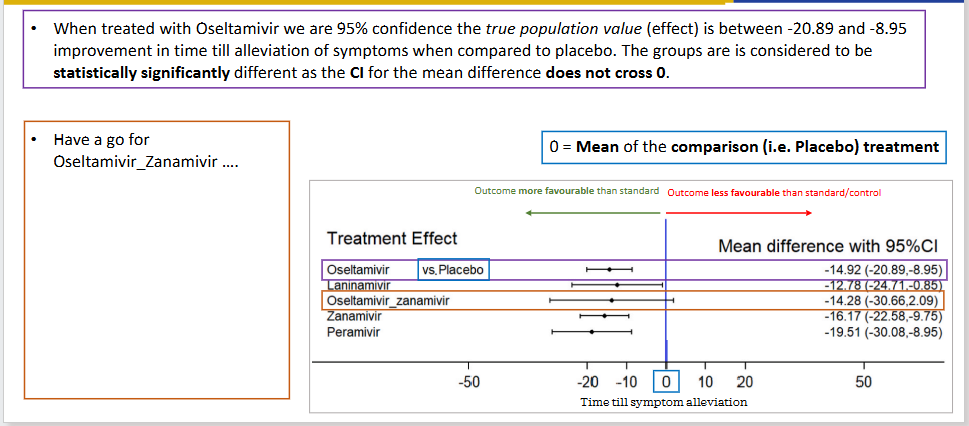
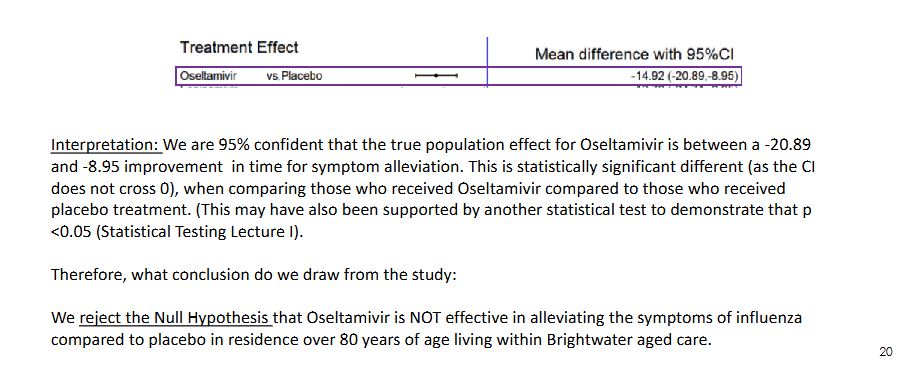
What did the neuraminidase-inhibitor forest plot report for time to influenza symptom alleviation?
Mean difference with 95% CI:
- Oseltamivir vs placebo: −14.92 (−20.89, −8.95)
- Laninamivir: −12.78 (−24.71, −0.85)
- Oseltamivir + zanamivir: −14.28 (−30.66, 2.09)
- Zanamivir: −16.17 (−22.58, −9.75)
- Peramivir: −19.51 (−30.08, −8.95)
0 = mean of the comparison/placebo treatment.
Negative values were on the side labelled more favourable for time to symptom alleviation.

How is the null/no-difference value different for mean differences versus ratios?
Mean difference:
Null/no-difference value = 0.
.
Relative risk (RR), odds ratio (OR) and hazard ratio (HR):
Null/no-association value = 1.
.
Lecturer memory aid:
A 1:1 comparison means neither side has an advantage.
.
(Consider that if the bookies have the Fremantle vs Sydney grand final match at 1:1 no team is seen to have an advantage)

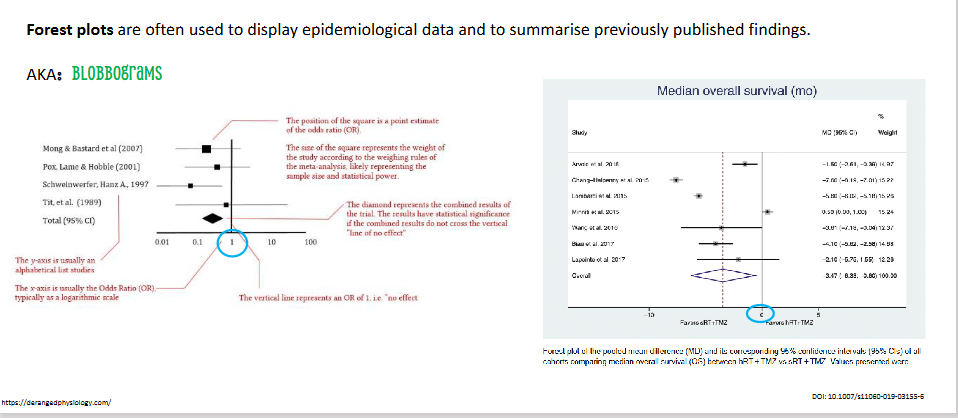
What is a forest plot and what does it commonly display?
A forest plot, also called a blobbogram, is commonly used to:
- Display epidemiological data.
- Summarise previously published findings.
- Show point estimates and confidence intervals from multiple studies or comparisons.
How should the oseltamivir confidence interval be interpreted?
Oseltamivir vs placebo:
Mean difference = −14.92
95% CI = −20.89 to −8.95
Interpretation:
We are 95% confident the true population effect lies between −20.89 and −8.95 for improvement in time to symptom alleviation compared with placebo.
Because the CI does not cross 0:
The groups are statistically significantly different.

How should the oseltamivir + zanamivir confidence interval be interpreted?
Oseltamivir + zanamivir:
Mean difference = −14.28
95% CI = −30.66 to +2.09
The interval spans:
- Potential improvement.
- Potential worsening/no benefit relative to placebo.
Because the CI crosses 0:
It is not statistically significantly different from placebo.
.
Lecturer explanation:
The true effect could plausibly be on either side of no difference.

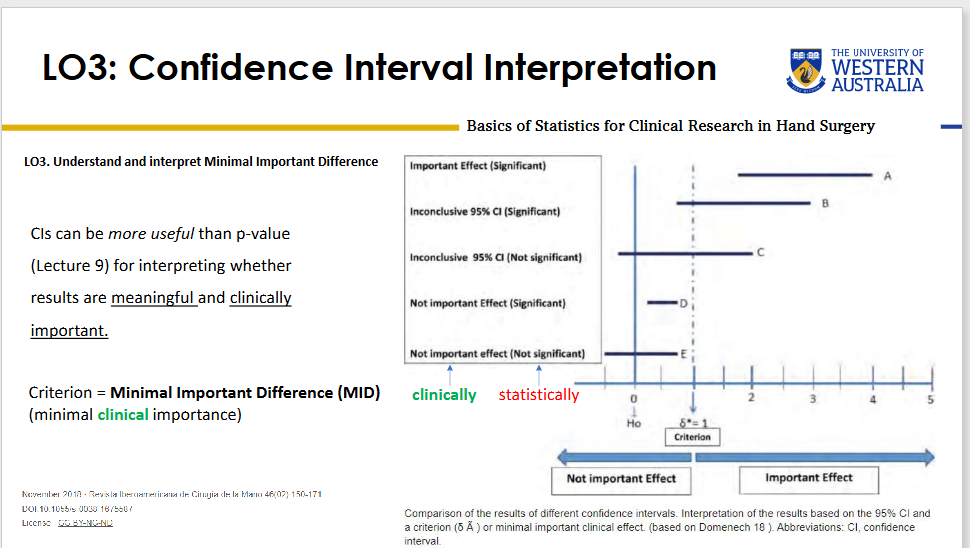
What is the Minimal Important Difference (MID)?
MID is the criterion representing the minimum effect considered clinically important.
It is used to judge whether an observed effect is meaningfully beneficial in practice, not merely statistically significant.
Lecturer emphasis:
Confidence intervals can be more informative than a p-value alone when deciding whether an effect is clinically worthwhile.

How can statistical significance and clinical importance differ?
Possible patterns include:
- Statistically significant AND clinically important.
- Statistically significant but clinical importance uncertain.
- Statistically significant but below the MID.
- Not statistically significant and clinically unimportant.
Lecturer example:
A treatment that shortens influenza symptoms by only about 1 hour could be statistically significant but still not worthwhile clinically.

What are the basic components of the research process shown in the lecture?
1. Develop an idea.
2. Literature review.
3. Clearly specify the study question and develop the hypothesis.
4. Choose the research/study design.
5. Address ethical issues.
6. Collect data: sampling and measuring the effect/intervention.
7. Analyse data using descriptive and inferential statistics.
8. Evaluate, interpret and discuss.
9. Publish.
Lecturer explanation:
The design and analysis should follow from the study question and hypothesis.
What is hypothesis testing?
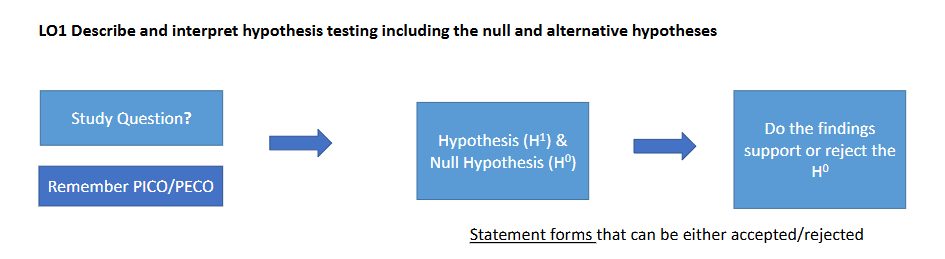
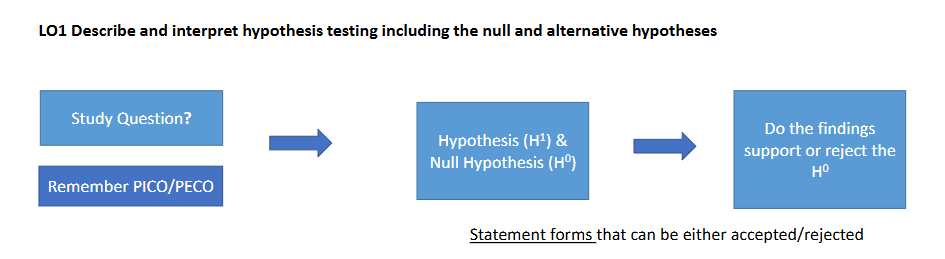
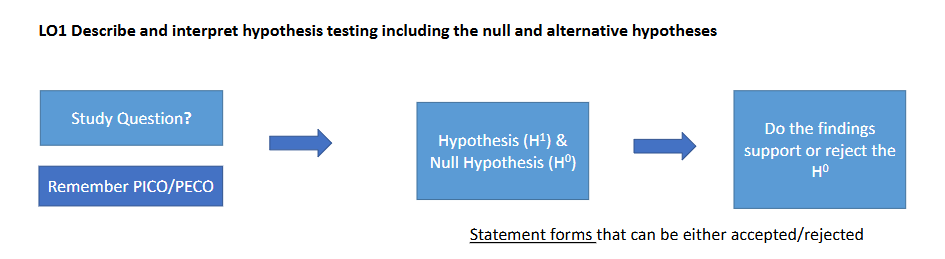
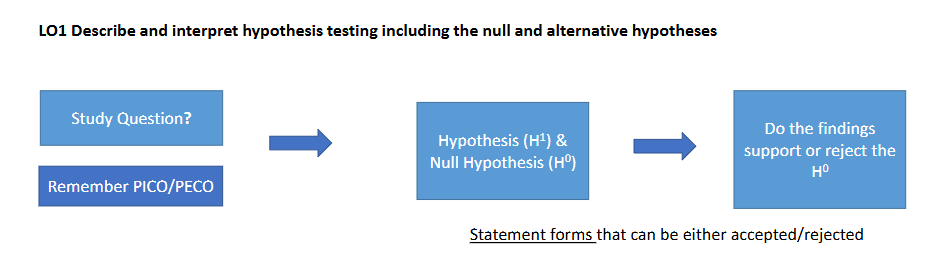
Hypothesis testing converts a study question, often framed using PICO/PECO, into statements that can be evaluated with data.
The researcher gathers evidence about whether groups are similar or different and how certain that evidence is.
Traditional null-hypothesis significance testing usually seeks evidence to reject H₀.

What are H₁ and H₀ in hypothesis testing?
Alternative/research hypothesis (H₁):
States that a change, difference or effect WILL be detected.
The direction of change does not have to be specified.
.
Null hypothesis (H₀):
States that there WON'T be a change, difference or effect.
Both are statements, unlike the original study question.

What evidence can be used to decide whether to reject H₀?
Examples from the lecture:
- Confidence intervals.
- p-values from statistical hypothesis tests.
.
Important:
A non-significant result does NOT prove "no effect" and does NOT prove that H₀ is correct.
It means the available evidence was insufficient to reject H₀.
How were the study question, H₁ and H₀ framed in the Brightwater oseltamivir example?
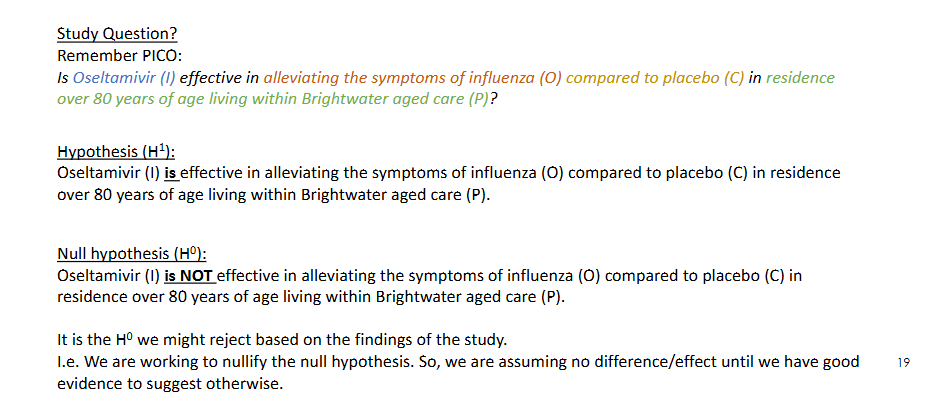
Study question:
Is oseltamivir effective in alleviating influenza symptoms compared with placebo in residents over 80 years old living within Brightwater aged care?
.
H₁:
Oseltamivir IS effective in alleviating influenza symptoms compared with placebo in this population.
.
H₀:
Oseltamivir is NOT effective in alleviating influenza symptoms compared with placebo in this population.
.
Lecturer explanation:
Researchers assume no effect until there is good evidence to suggest otherwise.

Why was H₀ rejected in the Brightwater oseltamivir example?
The oseltamivir mean difference had a 95% CI of −20.89 to −8.95.
Because:
- The CI did not cross 0.
- The result was statistically significant.
- A statistical test may also have supported p < 0.05.
.
Conclusion:
Reject H₀ that oseltamivir is not effective in alleviating influenza symptoms compared with placebo.


What is a Type I error?
Type I error = false positive.
The study rejects H₀ and concludes there is an association/effect when in reality there is not.
.
With a 95% confidence level:
There is a 5% chance of being wrong by chance.
.
With a 90% confidence level:
There is a 10% chance of being wrong by chance.


What is a Type II error?
Type II error = false negative.
The study fails to detect an association/effect and effectively "accepts" H₀ when an effect actually exists.

What factors can contribute to Type I versus Type II errors?
Type I error:
- Non-random sampling that is not representative of the population.
- Significance level not rigorous enough.
.
Type II error:
- Sample size too small.
- Insufficient statistical power.
Lecturer explanation:
Larger samples make it easier to detect a real effect at the 0.05 significance level.
What is statistical power?
Statistical power is the probability of detecting/capturing an effect if that effect truly exists.
.
Example definition from the lecture:
Finding a difference between two population means, assuming the difference exists.
Range:
0 to 1.
.
Common target:
0.8 = 80% probability of detecting the hypothesised population effect.
.
Lecturer emphasis:
Power should be considered before the study begins, including when planning funding and recruitment.

What three main factors determine statistical power?
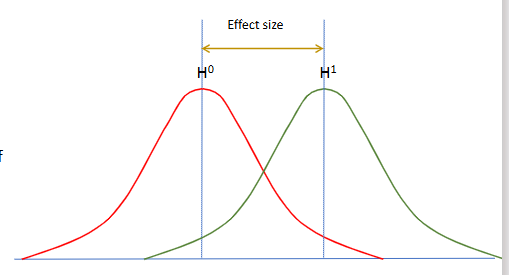
1. Magnitude/effect size.
2. Alpha level (α), the probability of Type I error.
3. Sample size.
.
Typical alpha:
α = 0.05.
Larger effect size:
Easier to detect.
Larger sample size:
Increases power for a given alpha and effect size.
What is the purpose of a power calculation?
To determine the minimum sample size required to have adequate probability of detecting the expected effect using the planned statistical test.
Lecturer explanation:
This should be done before recruitment so the study is not underpowered and wasteful.
What did the analysis of 136,212 clinical trials show about statistical power?
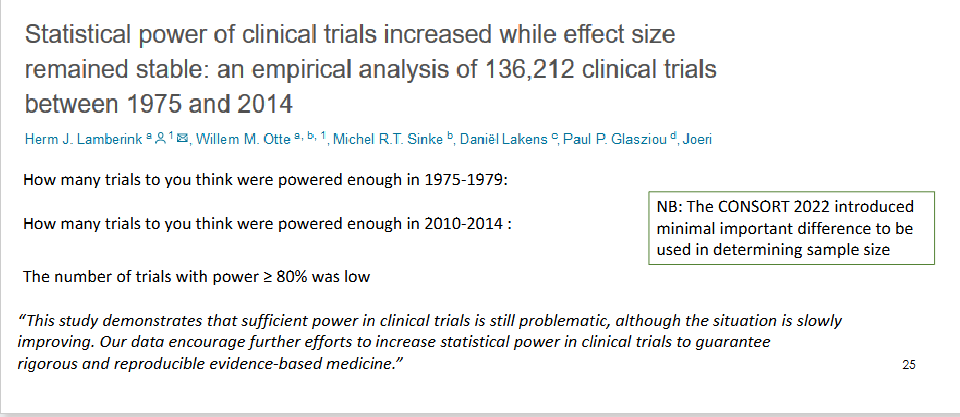
The cited analysis examined clinical trials from 1975-2014.
.
Lecturer explanation:
- About 5% of trials in 1975-1979 were adequately powered.
- About 9% in 2010-2014 were adequately powered.
- Power ≥80% remained uncommon despite improvement.
.
The lecture also noted:
CONSORT 2022 introduced use of Minimal Important Difference in determining sample size.

How can study power be increased?
Possible approaches:
- Increase α, although this is NOT recommended because it increases Type I error risk.
- Reduce the number of dependent variables.
- Reduce measurement error by using precise/reliable and accurate/valid tools.
- Increase the treatment effect by recruiting the most appropriate population, guided by literature.
- Recruit the correct number of participants.
- Use a power calculation to determine minimum sample size.
.
Lecturer explanation:
Starting sample size should also allow for expected drop-outs and loss to follow-up.
Why can an overpowered study also be undesirable?
Recruiting far more participants than required can waste:
- Resources.
- Time.
- Participant involvement.
The goal is to recruit enough participants to achieve adequate power, not simply as many as possible.
Q1 An immunologist wants to investigate whether a new antiviral drug reduces influenza symptoms compared with placebo.
Which statement best represents the null hypothesis?
A. There is no difference in symptom reduction between the antiviral and placebo.
B. The antiviral reduces symptoms compared with placebo.
C. The antiviral is superior to placebo.
D. The antiviral is clinically important.
Correct answer:
A. There is no difference in symptom reduction between the antiviral and placebo.
Why it is correct:
H₀ states that there is no change/difference/effect.
Why the other options are incorrect:
B. This states an effect and therefore aligns with H₁.
C. This also asserts an effect rather than no difference.
D. Clinical importance is a separate concept from the null hypothesis.
Q2 Researchers report a mean pain score of 40 with a narrow 95% confidence interval.
What is the most appropriate interpretation?
A. The treatment is clinically effective.
B. The sample size is small.
C. The population mean has been estimated with relatively high precision.
D. The study has high statistical power.
Correct answer:
C. The population mean has been estimated with relatively high precision.
Why it is correct:
A narrow CI indicates greater precision around the estimated population value.
Why the other options are incorrect:
A. A narrow CI alone does not establish clinical effectiveness.
B. Larger rather than smaller samples generally narrow CIs.
D. CI width alone does not directly prove that overall study power is high.
Q3 A study compares a new antihypertensive drug with standard therapy.
The mean difference in systolic blood pressure is -8 mmHg (95% CI: -12 to -4 mmHg). What conclusion is most appropriate?
A. The treatments are equivalent.
B. The new treatment does not significantly lower blood pressure compared with standard therapy.
C. The new treatment significantly lowers blood pressure compared with standard therapy.
D. The study demonstrates a Type II error.
Correct answer:
C. The new treatment significantly lowers blood pressure compared with standard therapy.
Why it is correct:
For a mean difference, 0 is the no-difference value. The entire CI lies below 0.
Why the other options are incorrect:
A. The CI does not support equivalence.
B. The CI excludes 0, supporting a statistically significant difference.
D. A Type II error is a false negative, which is not the pattern shown here.
Q4 In a RCT, a new orthopaedic medical device produces a statistically significant improvement in knee function, in comparison to the standard treatment, but the effect size remains below the established Minimal Important Difference.
What does this suggest?
A. The treatment is ineffective, and device shouldn't be used.
B. The confidence interval crosses the line of zero (0) mean difference.
C. The result may be statistically significant but not clinically meaningful.
D. Type I error has occurred in the study, and the study should be repeated.
Correct answer:
C. The result may be statistically significant but not clinically meaningful.
Why it is correct:
MID is the threshold for clinical importance, so an effect below MID may lack meaningful clinical benefit despite statistical significance.
Why the other options are incorrect:
A. The lecture does not say such a treatment is necessarily completely ineffective.
B. The question already states that the result is statistically significant.
D. Statistical significance below MID does not itself prove a Type I error.
Q5 A study fails to detect a statistically or clinically significant treatment effect because the sample size is too small.
This is most consistent with:
A. Type I error
B. Type II error
C. Selection bias
D. Recall bias
Correct answer:
B. Type II error
Why it is correct:
A too-small sample can produce insufficient power and a false negative.
Why the other options are incorrect:
A. Type I error is a false positive.
C. Selection bias is not the error described.
D. Recall bias is not the error described.
Q6 A study has a statistical power of 0.80. What does this mean?
A. The confidence interval contains the true value 80% of the time.
B. There is an 80% chance of a Type I error.
C. The study is 80% accurate.
D. There is an 80% probability of detecting a real effect if one exists.
Correct answer:
D. There is an 80% probability of detecting a real effect if one exists.
Why it is correct:
Power is the probability of detecting an effect assuming that effect exists.
Why the other options are incorrect:
A. This is not the definition of power.
B. α, not power, describes Type I error probability.
C. Power is not a general measure of study "accuracy".
What are the four learning outcomes for measures of association?
1. Identify and evaluate relevant measures of disease frequency: incidence and prevalence.
2. Identify and evaluate relevant measures of association for cohort and case-control study designs.
3. Calculate and interpret odds ratio (OR) and relative risk/risk ratio (RR).
4. Interpret these measures and evaluate claims about exposure or treatment effects.
Not required:
Calculating confidence intervals.

What is epidemiology concerned with, and what historical ideas were linked to Hippocrates?
Epidemiology asks:
How often diseases occur in different groups of people, and why.
.
Etymology:
"The study of what is upon the people."
.
The slide links Hippocrates with early epidemiological ideas including:
- Climate, seasonal variation and location as possible causes.
- Habits, regimens and personal pursuits associated with disease.
- Case-series descriptions.
- Age, gender, residence and seasonal conditions.
- Morbidity and mortality outcomes.
- Disease transmission.
- Predispositions associated with disease.

What are incidence, point prevalence and period prevalence?
Incidence:
New cases occurring over a defined period.
.
Point prevalence:
Existing disease measured at one point in time.
.
Period prevalence:
Existing disease measured cumulatively over a period of time.
.
Lecturer explanation:
The time frame chosen should be biologically relevant to disease development.
.
These are dichotomous outcomes:
Condition present vs condition absent.

How do prevalence and incidence differ in numerator, denominator, purpose and units?
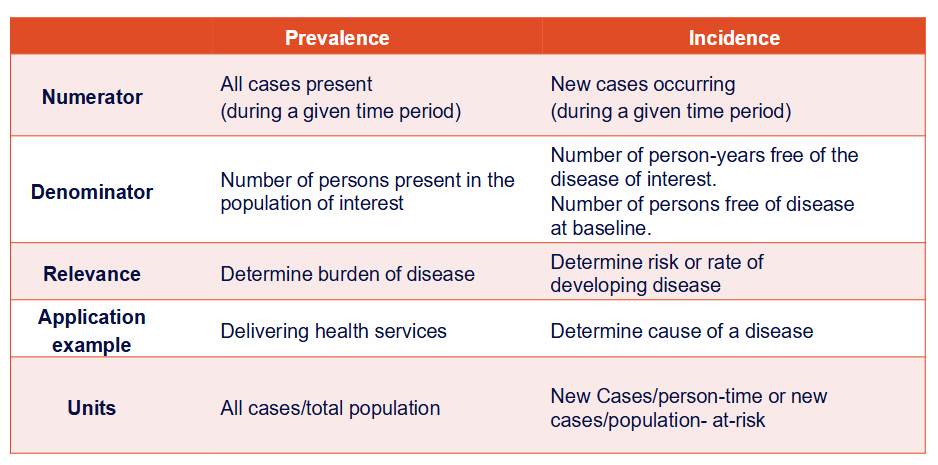
Prevalence:
- Numerator: all cases present during the time period.
- Denominator: persons present in the population of interest.
- Relevance: burden of disease.
- Application: planning/delivering health services.
- Units: all cases / total population.
.
Incidence:
- Numerator: new cases during the time period.
- Denominator: person-years free of disease or persons free of disease at baseline.
- Relevance: risk/rate of developing disease.
- Application: investigating causes.
- Units: new cases/person-time or new cases/population at risk.
How can prevalence be used to estimate an individual's pre-test probability?
Example:
Peak influenza prevalence in Boorloo/Perth in 2019 = 8.8 per 1000 people.
Equivalent estimated risk at that time:
0.88%, if nothing else is known about the individual.
.
Diagnostic/screening use:
1. Estimate pre-test probability.
2. Convert to pre-test odds.
3. Apply PLR or NLR depending on the test result.
4. Obtain post-test odds.
5. Convert to post-test probability.
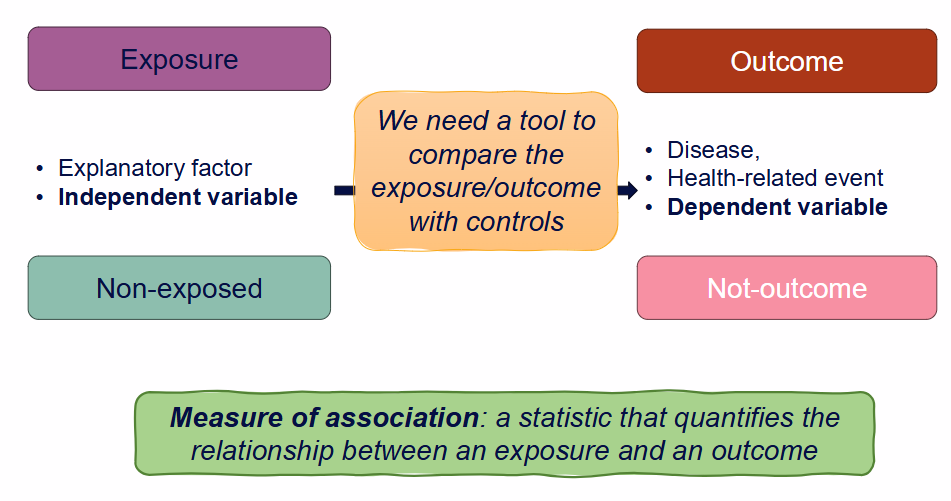
What are exposure and outcome variables in epidemiology?
Exposure:
- Explanatory factor.
- Independent variable.
.
Outcome:
- Disease or health-related event.
- Dependent variable.
.
Lecturer explanation:
A study needs comparison groups, not merely an observed exposure and outcome.

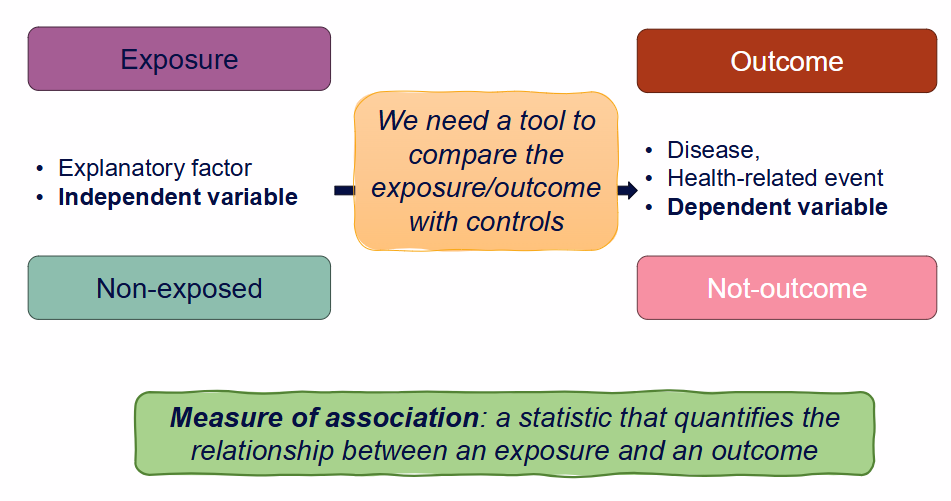
What is a measure of association?
A statistic that quantifies the relationship between an exposure and an outcome by comparing relevant exposed/non-exposed and outcome/non-outcome groups.
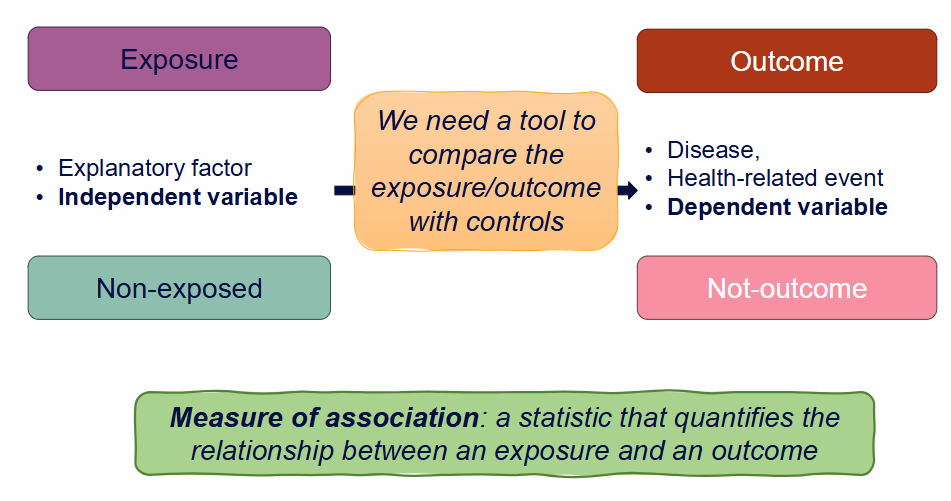

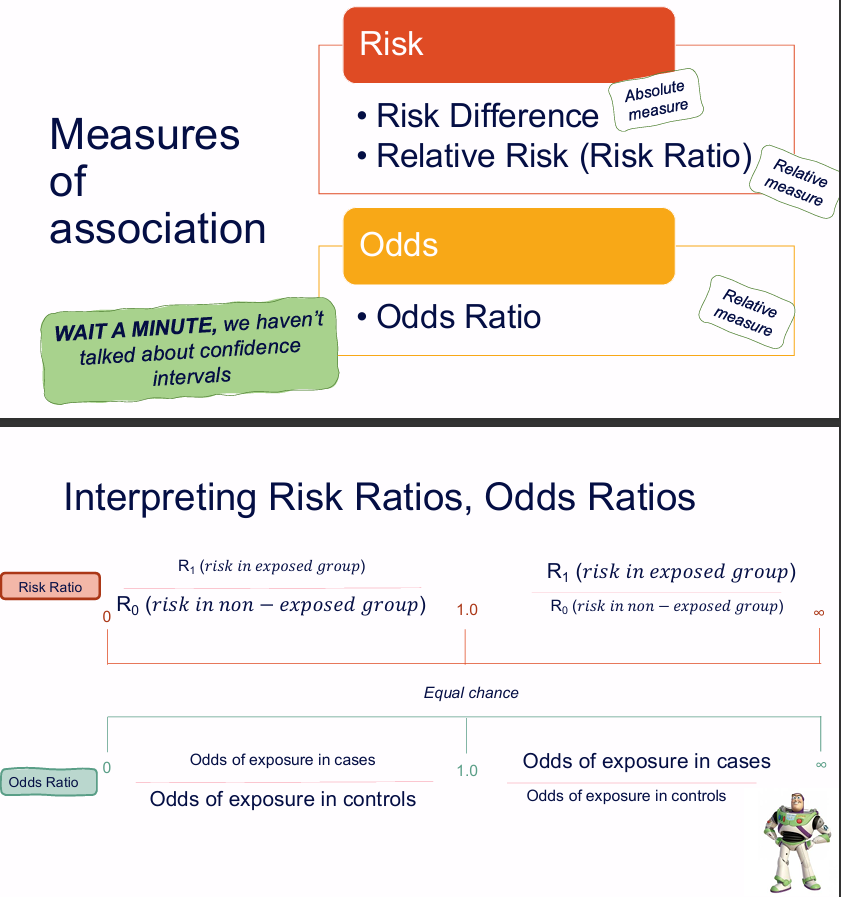
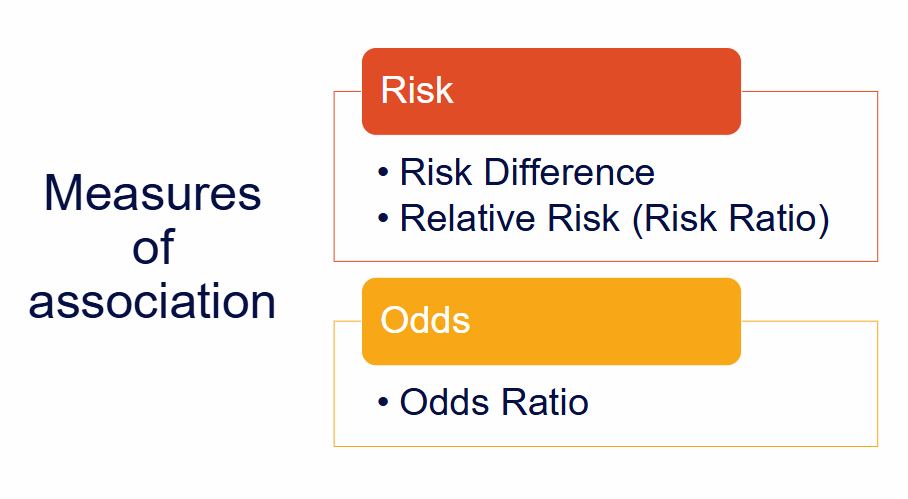
What are the main measures of association covered in the lecture?
Risk-based:
- Risk Difference (RD): absolute measure.
- Relative Risk/Risk Ratio (RR): relative measure.
.
Odds-based:
- Odds Ratio (OR): relative measure.
.
Bonus:
- Hazard Ratio (HR): relative time-to-event measure.

How is risk calculated in exposed and non-exposed groups from a 2×2 table?
For:
Exposed: disease = a, no disease = b
Not exposed: disease = c, no disease = d
Risk in exposed:
R₁ = a/(a+b) = a/n₁
Risk in non-exposed:
R₀ = c/(c+d) = c/n₀


How is Risk Difference (RD) calculated and what does it represent?
RD = R₁ − R₀
Where:
R₁ = risk in exposed group.
R₀ = risk in non-exposed group.
It is an absolute measure of the difference in risk between groups.
.
it is the difference between the risk of developing the condition of those exposed minus the risk of those developing the condition of those not exposed


How is Relative Risk/Risk Ratio (RR) calculated and what does it represent?
RR = R₁ / R₀
= risk in exposed group / risk in non-exposed group.
It is a relative measure describing how risk differs between exposure groups.

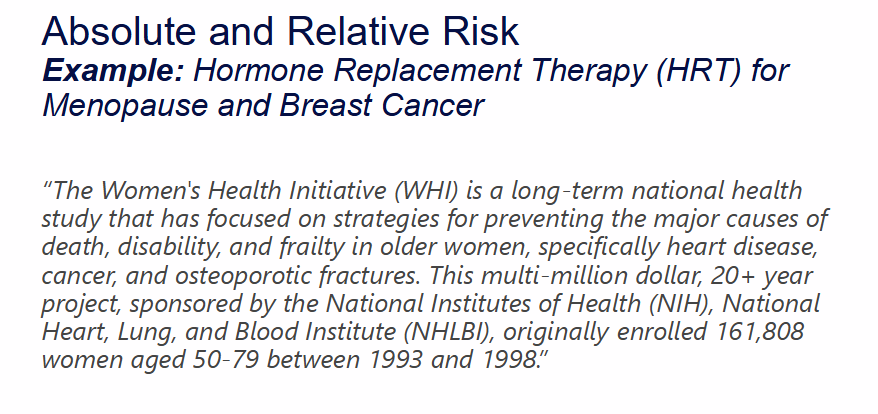
What was the Women's Health Initiative (WHI) HRT example used to demonstrate?
The WHI enrolled 161,808 women aged 50-79 between 1993 and 1998 and examined major causes of death, disability and frailty.
The lecture used its HRT and breast-cancer data to demonstrate that:
- Absolute risk and relative risk can describe the same data very differently.
- Relative-risk headlines can sound much more dramatic when the baseline risk is low.


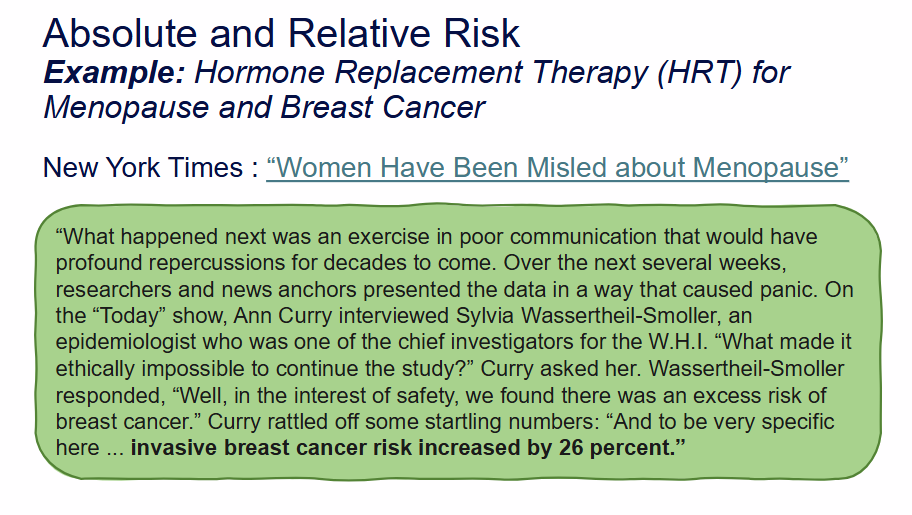
Why was the statement that HRT increased invasive breast-cancer risk by 26% potentially misleading?
It reported a relative-risk increase without the absolute-risk context.
Lecturer explanation:
A 26% relative increase sounds very large, but the underlying risks were both low, so the absolute increase was much smaller.
This illustrates how mathematically correct risk communication can still create a misleading impression.
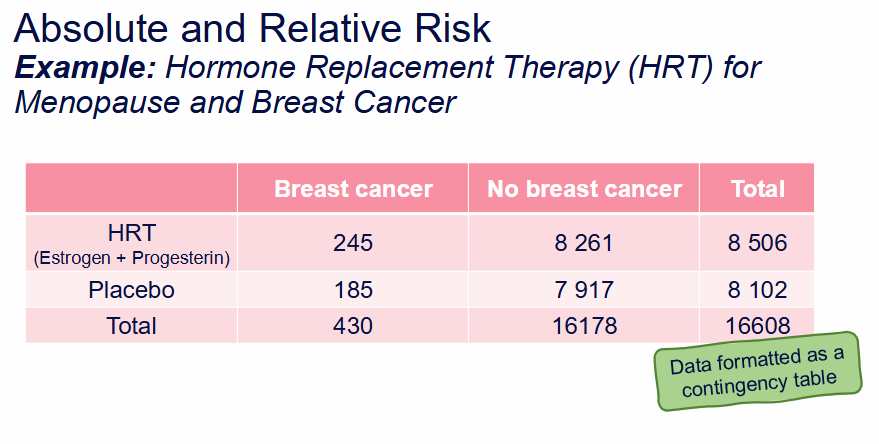
What were the breast-cancer counts in the WHI HRT contingency table?
HRT (oestrogen + progestin):
- Breast cancer: 245
- No breast cancer: 8,261
- Total: 8,506
.
Placebo:
- Breast cancer: 185
- No breast cancer: 7,917
- Total: 8,102
.
Overall:
- Breast cancer: 430
- Total: 16,608

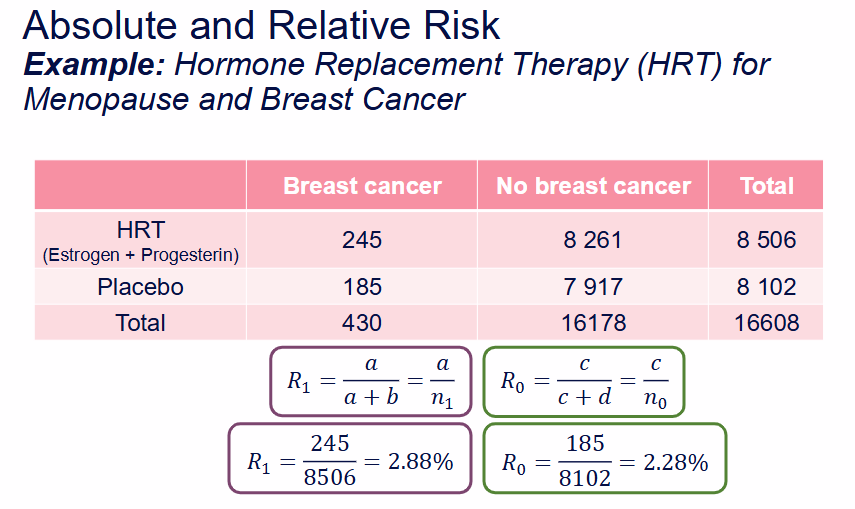
What were the breast-cancer risks in the HRT and placebo groups?
HRT:
R₁ = 245/8506 = 2.88%
Placebo:
R₀ = 185/8102 = 2.28%

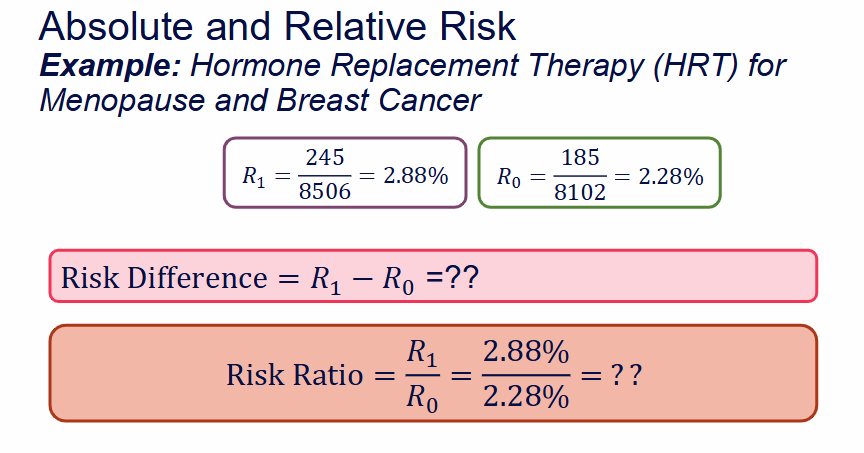
What were the risk difference and risk ratio for breast cancer in the WHI HRT example?
Risk Difference:
2.88% − 2.28% = 0.6%
Risk Ratio:
2.88% / 2.28% = 1.26 = 126%
Relative increase:
26%
.
Lecturer emphasis:
The same data can be communicated as a 0.6% absolute increase or a 26% relative increase.


Why can relative risk exaggerate the apparent importance of an effect when baseline risk is small?
When both baseline risks are very small, a small absolute change can create a large proportional/relative change.
Therefore:
Relative risk describes strength/direction of association, but it does not tell the reader how many people are actually affected.


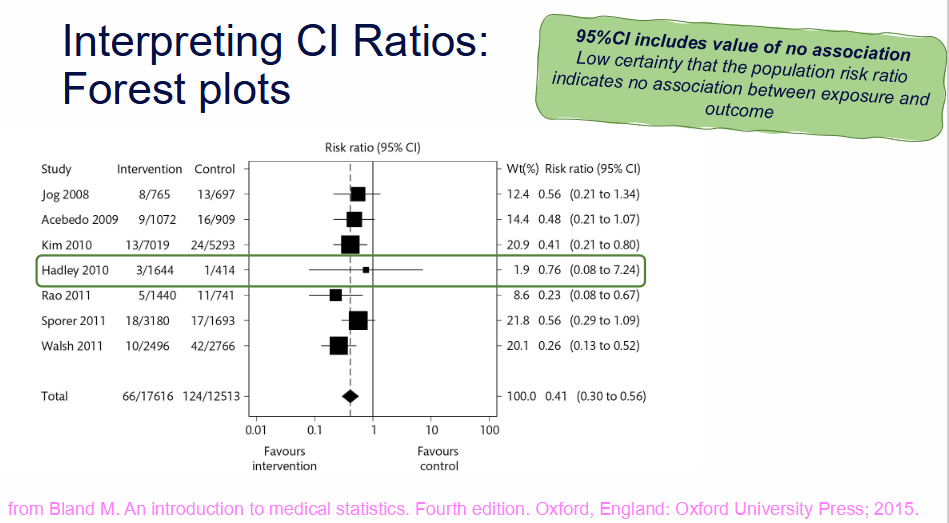
How are confidence intervals interpreted for ratio measures such as RR and OR?
Ratio measures estimated from a sample have uncertainty.
Wider CI:
Less precise estimate.
.
95% CI:
Range in which the population ratio is expected to lie.
.
Null/no-association value:
1.
If the CI includes/crosses 1:
The association is not statistically significant at the conventional level.
What did the later Cochrane HRT review illustrate about interpreting treatment risks?
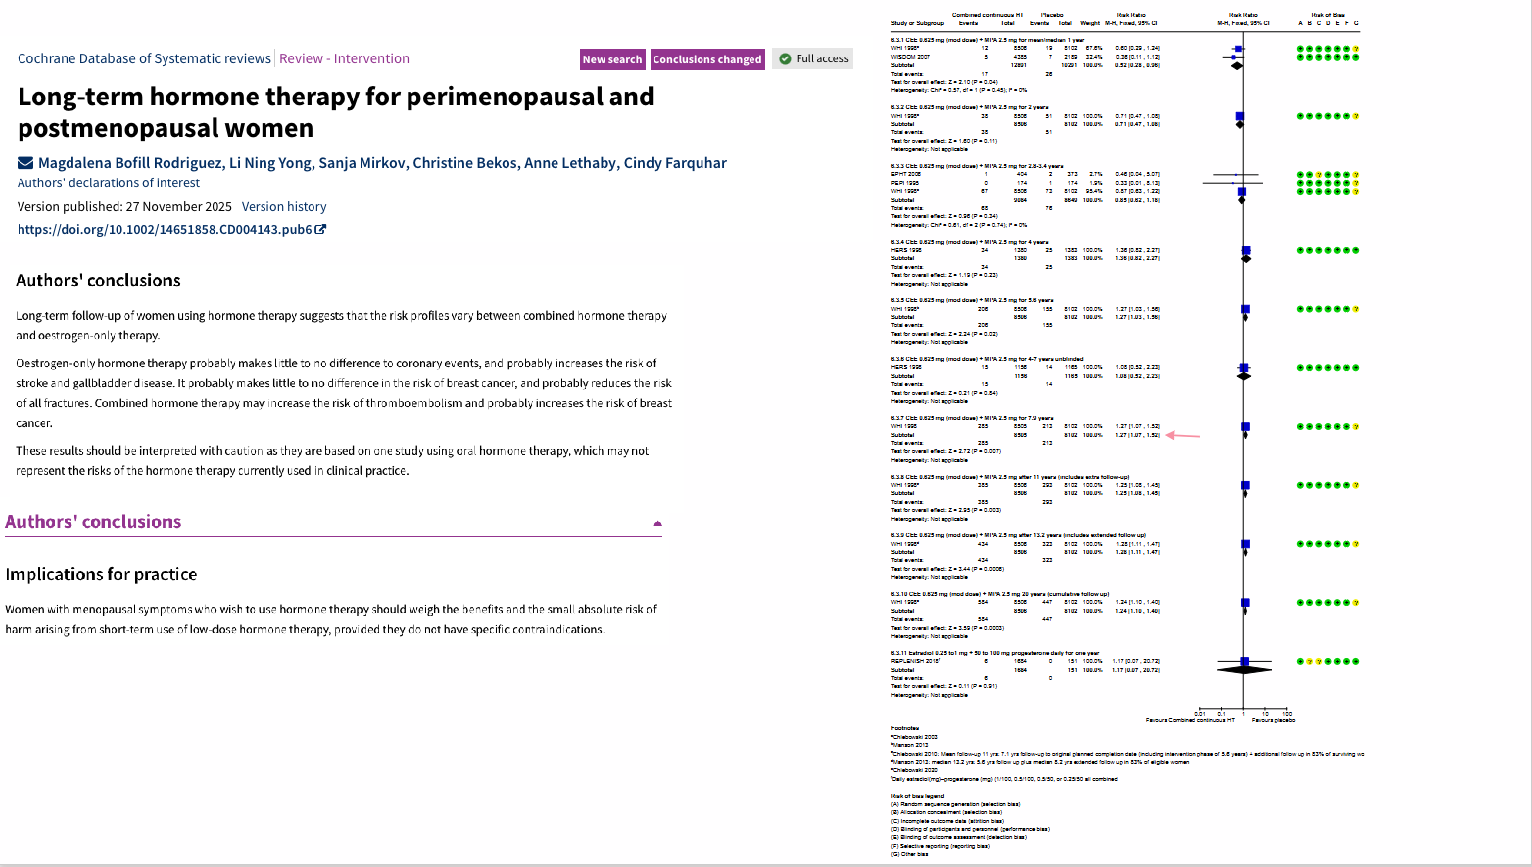
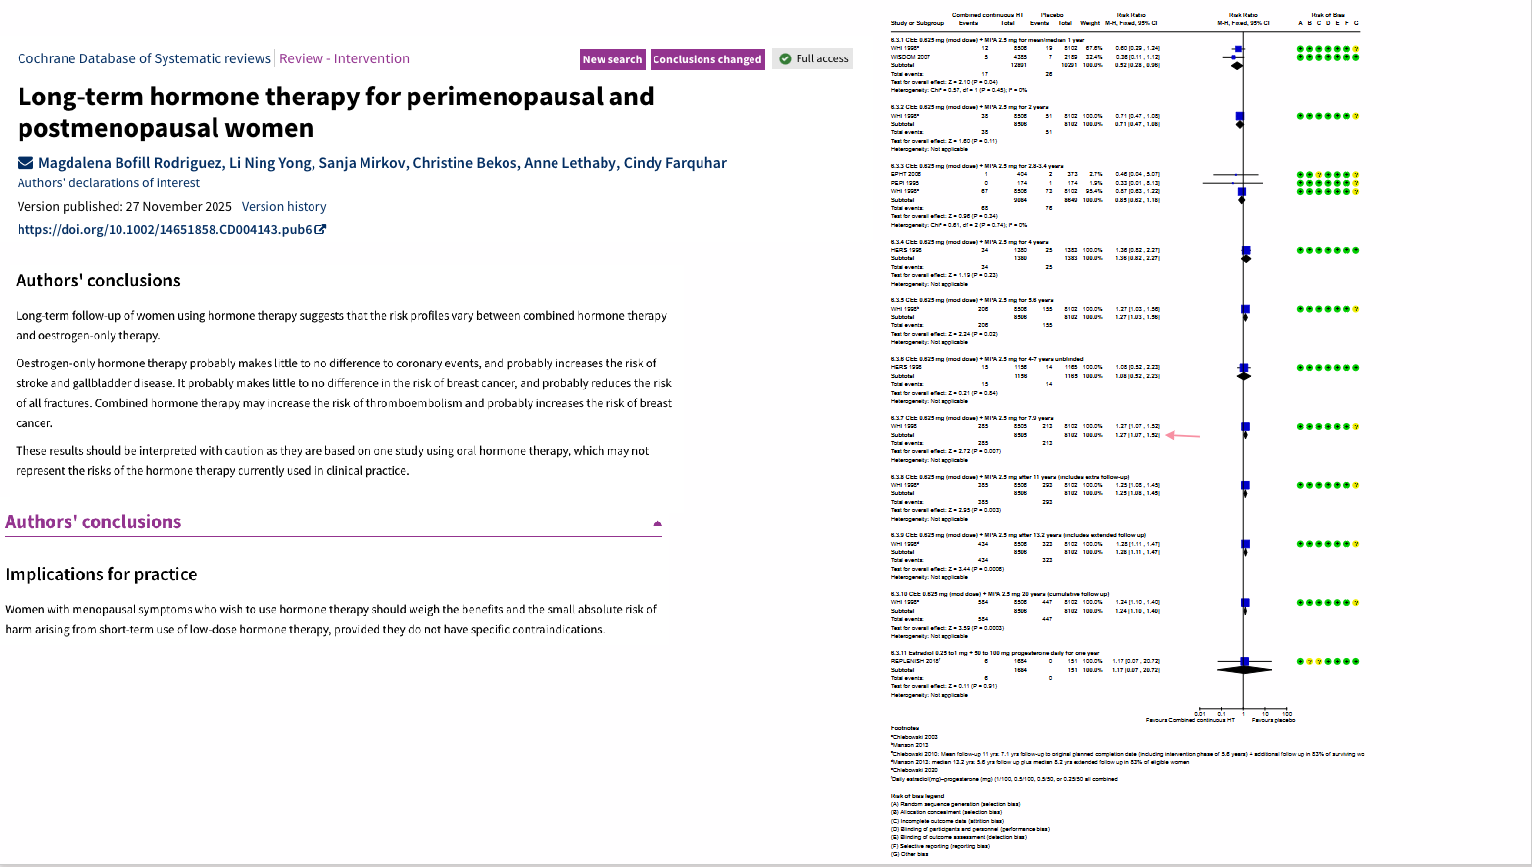
The lecture revisited HRT using a later Cochrane review.
Lecturer explanation:
- HRT formulations, doses and routes have changed over time.
- Interpretation should weigh benefits against the small absolute risk of harm.
- A relative-risk headline alone should not drive clinical decisions.

How is a relative risk interpreted when RR = 1, RR > 1 or RR < 1?
RR = 1:
No difference or little difference in risk.
.
RR > 1:
Increased risk of the outcome in the exposed group.
.
RR < 1:
Reduced risk of the outcome in the exposed group.
.
Lecturer explanation:
Whether an increase or decrease is desirable depends on whether the outcome is harmful or beneficial.

What are the strengths and limitations of Risk Difference/Absolute Risk Reduction?
Strengths:
- Absolute difference in risk between groups.
- Easy to interpret and communicate.
- Can be used to calculate Number Needed to Treat:
NNT = 1/ARR, or 1/RD when RD represents absolute risk reduction.
.
Limitation:
A very small numerical risk reduction can sound practically insignificant even when the prevented outcome is very serious.

What did the vitamin K at birth example show about absolute risk reduction?
Haemorrhagic disease of the newborn:
No vitamin K:
19 cases / 220,000 ≈ 0.008%
Intramuscular vitamin K:
0 cases / 945,000 = 0%
.
Absolute reduction:
About 0.008%.
Lecturer emphasis:
Although numerically tiny, this is clinically important because haemorrhagic disease of the newborn is a serious condition with high mortality.


How do Risk Difference and Relative Risk differ in what they communicate?
Risk Difference / Absolute Risk Reduction:
- Difference in risk between groups.
- Easier for people to understand.
- Tells how much absolute risk changes.
.
Relative Risk:
- Relationship in risk status associated with exposure/treatment.
- Shows direction and strength of association.
- Does not directly indicate the number of people affected.


Why are cohort studies appropriate for calculations of risk?
Cohort studies begin with a population at risk grouped by exposure status and follow participants to outcomes.
Because the numbers exposed and non-exposed arise from the cohort rather than being artificially selected by outcome status, incidence/risk can be calculated.

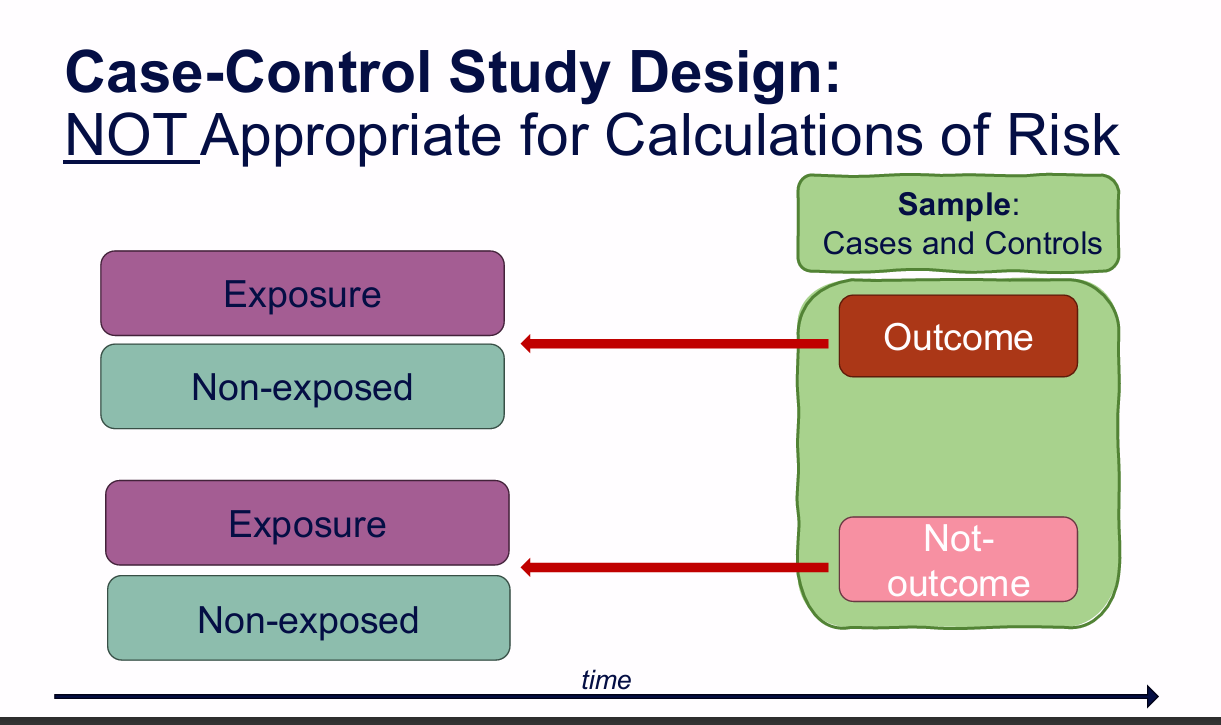
Why are case-control studies NOT appropriate for direct calculations of risk or RR?
Case-control studies:
- Select participants based on outcome status: cases and controls.
- Then look backwards at exposure.
Researchers choose the case:control ratio.
Therefore:
The proportion of cases in the sample does not represent disease incidence/prevalence in the population, so direct risk and RR calculations are invalid.

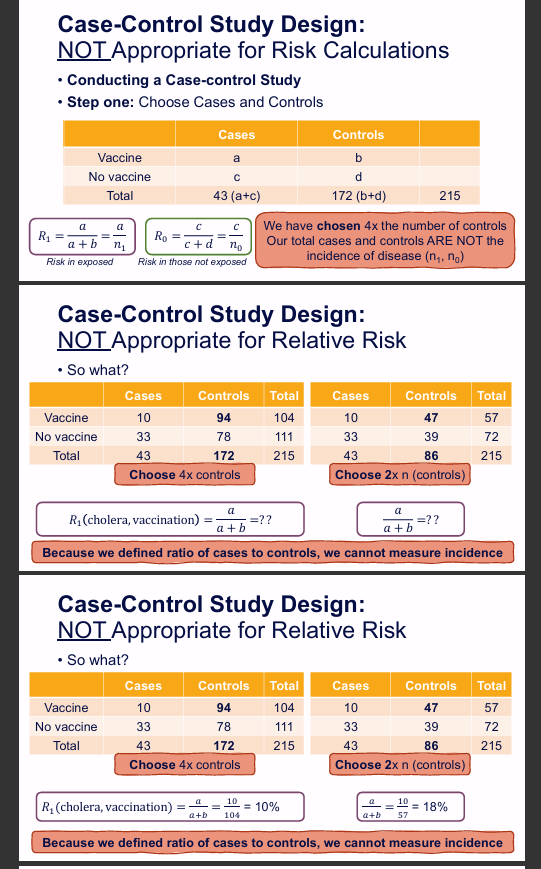
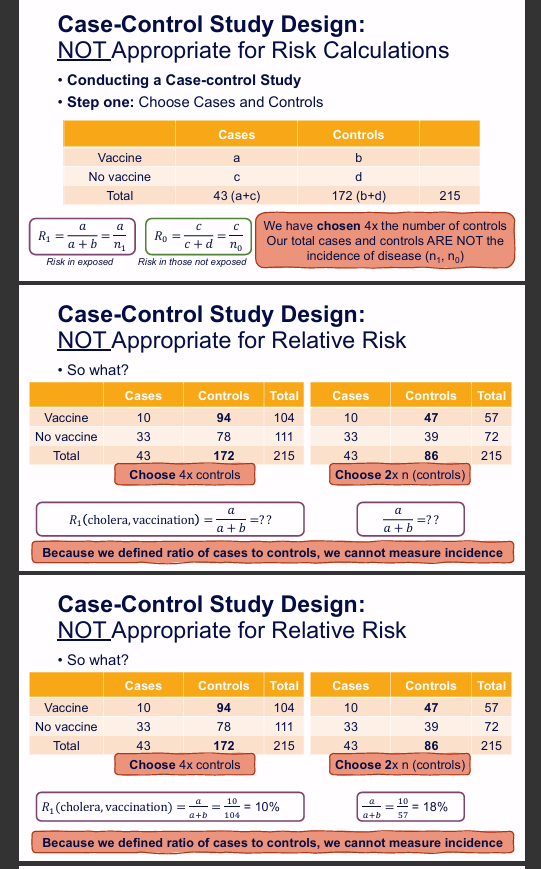
How did changing the number of controls demonstrate why case-control samples cannot estimate risk?
Case-control example:
With 4× controls:
Vaccinated apparent disease proportion:
10/104 ≈ 10%
With 2× controls:
Vaccinated apparent disease proportion:
10/57 ≈ 18%
The underlying case information did not change; only the number of selected controls changed.
Conclusion:
The apparent "risk" changes artificially, proving that incidence/risk cannot be estimated directly from a case-control sample.

What is odds, and how is it calculated?
Odds:
O = p/(1−p)
= probability of event / probability of event not occurring.
.
Coin example:
p(heads) = 0.5
.
Odds of heads:
0.5/(1−0.5) = 1
Equivalent:
heads : tails = 1:1
.
Why odds?
- Mathematically useful.
- Not affected by the selected prevalence in a case-control sample.


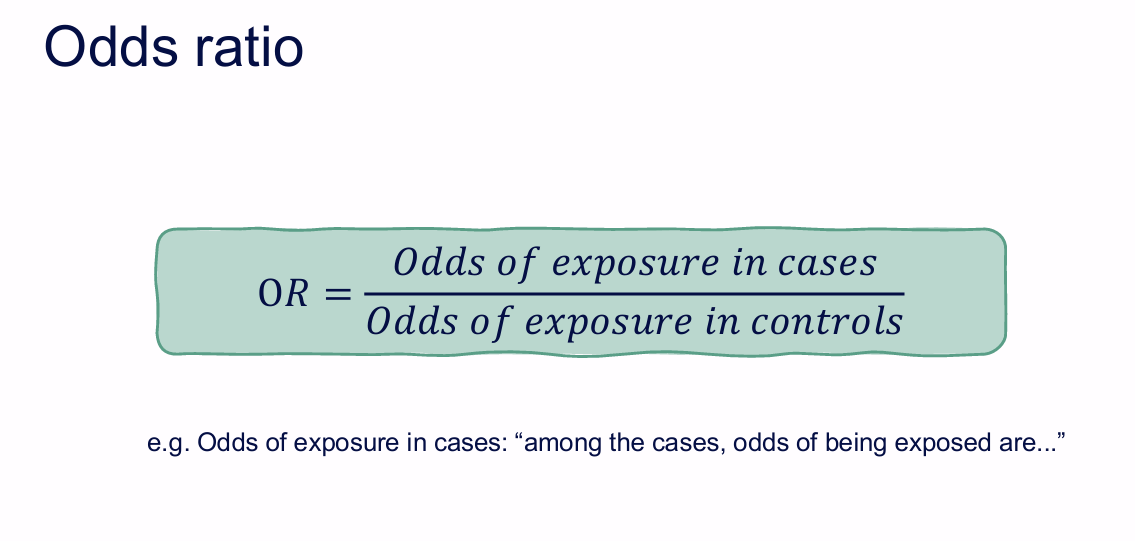
How is an odds ratio (OR) defined for a case-control study?
OR = odds of exposure in cases / odds of exposure in controls.
Interpretive wording:
"Among the cases, the odds of being exposed are ... relative to the controls."

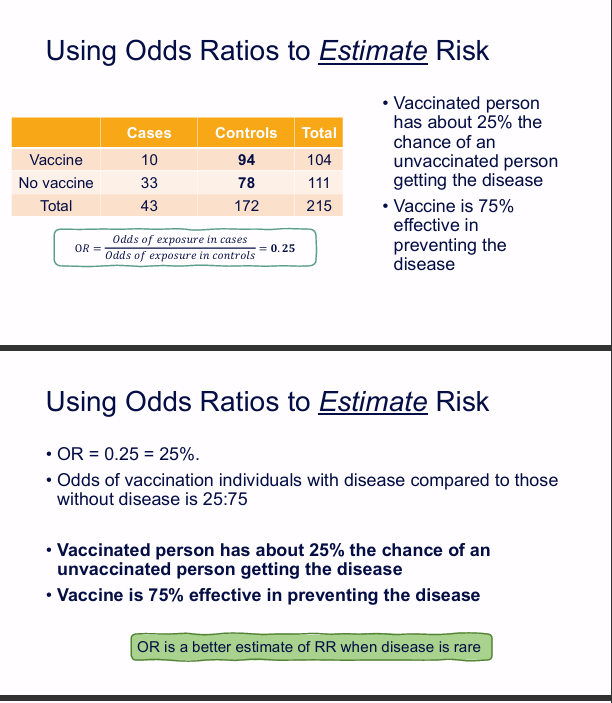
How was the vaccine odds ratio calculated with four controls per case?
Cases/controls:
- Vaccine: 10 cases, 94 controls
- No vaccine: 33 cases, 78 controls
Odds of vaccination in cases:
10/33 = 0.303
Odds of vaccination in controls:
94/78 = 1.205
OR:
(10/33)/(94/78)
= 0.303/1.205
= 0.25


Why does the vaccine OR remain 0.25 when the number of controls is halved?
With 2× controls:
- Vaccine: 10 cases, 47 controls
- No vaccine: 33 cases, 39 controls
OR:
(10/33)/(47/39)
= 0.303/1.205
= 0.25
The proportional reduction in controls does not change the exposure odds ratio.
Conclusion:
OR is not affected by the artificially selected case-control "prevalence", so it is suitable for case-control studies.


How is an odds ratio interpreted when OR = 1, OR > 1 or OR < 1?
OR = 1:
No evidence of an association; exposure odds are the same in cases and controls.
.
OR > 1:
Positive association.
Higher odds of exposure in cases, or lower odds in controls.
.
OR < 1:
Negative association.
Lower odds of exposure in cases, or higher odds in controls.
Lecturer emphasis:
Use "odds" language rather than automatically calling OR a risk ratio.


How was OR = 0.25 interpreted in the vaccine example?
OR = 0.25 = 25%.
Slide interpretation:
- Vaccinated individuals have about 25% the chance of an unvaccinated person getting the disease.
- Vaccine is described as about 75% effective in preventing the disease.
Important lecturer qualification:
OR is a better estimate of RR when the disease is rare.


When is an odds ratio a better approximation of relative risk?
When the disease/outcome is rare.
Lecturer caution:
OR should not automatically be interpreted as if it were RR in every situation.

What is a hazard ratio (HR)?
A relative time-to-event measure.
The lecture described HR as comparing the slopes/rates of two survival curves over time.
Example:
HR = 2 means the event rate is about twice as high in the exposed group at each point, assuming the relative rate is sufficiently consistent.
Example outcome:
Rate of death in exposed is twice that of non-exposed.


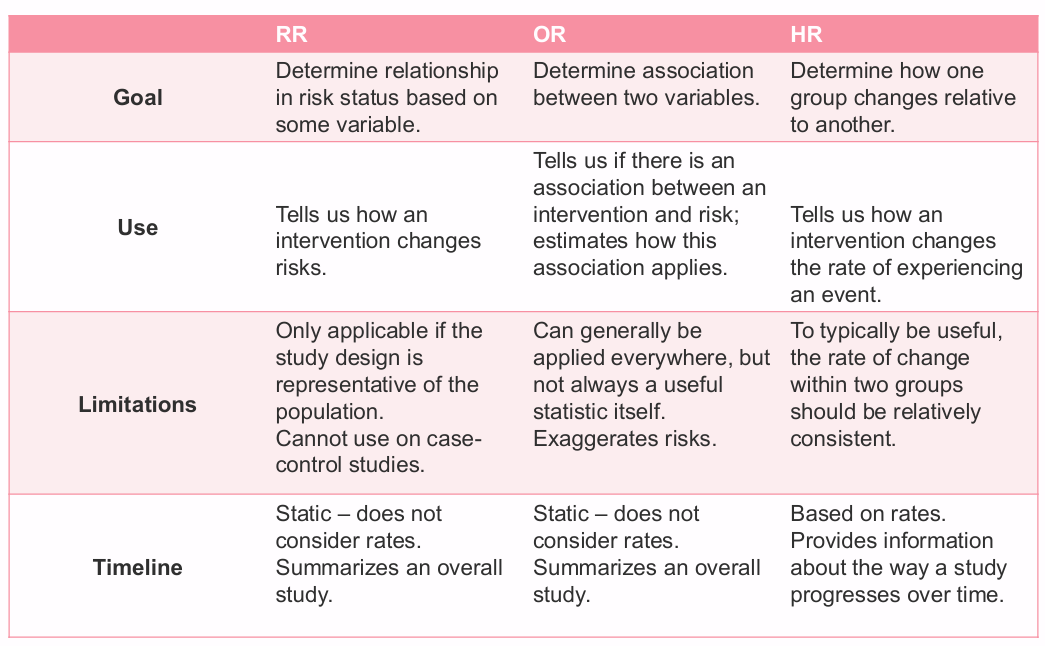
How do RR, OR and HR differ in their goals, uses, limitations and treatment of time?
RR:
- Goal: relationship in risk status based on a variable.
- Use: how an intervention changes risk.
- Limitation: requires a design representative enough to estimate risk; cannot be used directly in case-control studies.
- Timeline: static overall summary, not rate-based.
.
OR:
- Goal: association between two variables.
- Use: whether exposure and outcome are associated.
- Limitation: may exaggerate apparent risk; not always clinically intuitive.
- Timeline: static overall summary.
.
HR:
- Goal: how one group changes relative to another over time.
- Use: how an intervention changes the rate of experiencing an event.
- Limitation: most useful when relative rates between groups are reasonably consistent.
- Timeline: explicitly rate/time based.

What is the common null value for RR, OR and HR, and how should CIs be used?
Null/no-association value:
1.0
.
For RR, OR and HR:
- Value = 1 suggests equal chance/no association.
- Values above or below 1 indicate direction of association.
- A 95% CI crossing 1 means the data remain compatible with no association.
- A 95% CI entirely on one side of 1 supports statistical significance.