3. Demography / Demographic Changes
 Call Kai
 Learn
 Practice Test
 Spaced Repetition
 Match
 Flashcards
 Knowt Play
1/23

There's no tags or description
Looks like no tags are added yet.
24 Terms
What is the significance?
A basic structural frame of society
Determines certain possibilities: see the consequences of depopulation of rural areas, agglomeration of people in urban ones
Reflects major changes
One time events
Industrialization, but also service economy, secularization
Population in time
Society exists only if there is reproduction
Population-pyramid is a tool of representation of the age and gender dimensions of a given time
How are we grasping historical demography?
Sources
Censuses - modernity
Central Europe: Joseph II 1748-1787
Austrian census in 1857
Regular censuses from 1869 in every ten year
Russian empire: 1897 single census
International Statistical Congress Brussels 1853
International Statistical Institute
Census Data and its use
Composition of population:
Gender
Age
Occupation
Place of residence
Religion
Ethnicity
Material conditions
What were the early categories and why? (Language in absolutist censuses vs. in 1900?)
Why do we need census data?
Extrapolation from fragmented data
Conscriptions, tax registers, etc.
Birth, marriage and death registers
Fertility and childbearing age in the calculations
State registration (1895 Hungary)
France 1792, England 1837, Romania 1864, Spain 1870, Germany 1875, Austria 1939
Still today around 20-25% of births worldwide are not registered (later registration is possible!)
Population numbers
Continental/country variations
Basic calculation for demographic development happens usually within one jurisdiction (covered by birth, death and marriage data)
Population mobility between those jurisdictions is complementing the calculation — migration flows
Components of population movements
The rate and place of growth differed significantly, and showed different patterns throughout the long period
What’s behind the changes occurring in population tendencies?
Rate of birth: the total number of (live) births per 1000/population in a year or period
Fertility rate: the number of offspring born per mating pair, individual or population
Cohort and Total Fertility Rates
Rate of death (Mortality rate): a measure of the number of deaths (in general, or due to a specific cause) in a particular population, scaled to the size of that population, per unit of time
Migration: the movement of people from one place to the other to stay on for a considerable period of time for various reasons
World population movements…
Population movements in Europe (late 18th - 20th c.)
Macro-scale approach
The period is characterized by fast and continuous population growth (”demographic revolution” - A. Landry, 1934)
The growth of population in Western-Europe, 1700-1950 (%)
Showing the rate of growth in the population compared to the staring year of the period
Rate of death in Western-Europe
The rate of death declined gradually - although fluctuations were present
The difference between various countries is not remarkable (except between the two extreme ends: France & England)
The rate of decline increased after 1850-60 (greatest was the decline of infant mortality)
Pre-1880:
Germany, Netherlands, and Britain are characterized by “pre-industrial demographic behavior”
Birth rates are high and growing
France: the rate of birth is already declining by the end of the 18th century
Post 1880:
Decline of birth rates in Germany, Netherlands, and Britain is faster than in France in the same period
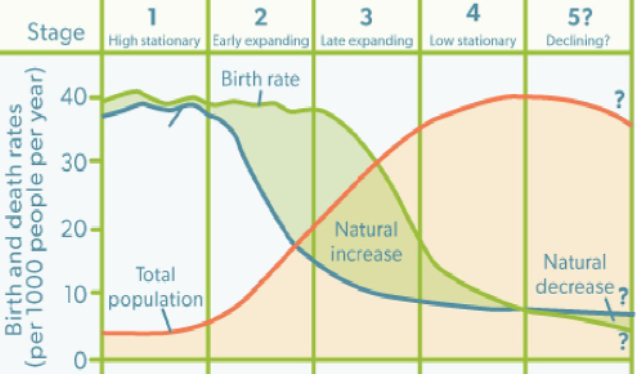
Demographic Transition Model (DTM) - driven by economic factors & the decline of mortality
A modernization model developed to describe the demographic “regime shift” — Fertility and mortality transitions
According to F. Notestein’s model:
Demographic transition was driven by economic factors that enabled and fuelled the decline of mortality rates
In pre-modern society, high mortality was inevitable, because the means of making it low had not been developed yet; for suvival, birth rates also had to be high.” […] “Peasant societies in Europe and almost universally throughout the world are organized in ways that bring strong pressures on their members to reproduce. These arrangements, which stood the test of experience throughout centuries of high mortality, are strongly supported by popular beliefs, formalized in religious doctrine, and enforced by community sanctions.”
When death rates are already low - only then it becomes possible to reduce fertility rates.
The reasons of declining birth rates are basically economic - and are dependent on modernization.
Ansley J. Coale - European Fertility Project (Princeton University)
Examination of the decline in marital fertility in Europe
Most important conclusion: even though economical factors (incl. educational level, level of urbanity, etc.) can play a role in fertility decline, these are not absolute determinants.
Notestein argues for very high fertility in all pre-modern societies
YETExamining empirical data on the fertility in pre-modern societies shows that it is not nearly as high as it might be/could be (instead of 10 - “natural fertility”, the range is from 4.1 in Denmark to 6.2 in India)
THUSA.J. Coale argues for a moderately high rather than very high (”natural”) fertility
Preconditions of fertility decline:
Within the conscious of choice”
If a society sees not having children as advantageous, then fertility will decline
Have contraception methods ready
Moderately high fertility of pre-modern societies VS Moderately high fertility modern societies
Pre-modern societies develop socially transmitted and socially enforced customs that lead to moderate reproduction:
Late marriage + a relatively high proportion of population that remains unmarried
Prohibition of widow remarriage
Extensive lactation
Taboo on intercourse when child is being nursed
Periodic seperation
In post-transition populations, couples change their practices after a certain number of children in order not to have any more (=parity-specific fertility, that depends on the number of children already born) by refined methods of termination
Why did fertility decrease?
DTM-explanation:
Fertility declined because the social and economic changes that are part of the modernization process made a reduction in fertility possible and needed to keep up the demographic equilibrium (amidst institutions of modern societies, there is no more need to reproduce in a “natural” rate)
EFP shows:
Fertility has never been “naturally” high
There is no checklist of modernization-factors that determine the decline of fertility (e.g.: level of literacy, increased education, proportion in non-agricultural employment, etc.) — various societies differ to a significant degree
There are cultural factors that help determine the start and spread of controlled fertility: populations of more secular, less religious orientation are prone to deliberate reduction of fertility: provide the possibility of conscious choice of contraception
DTM Variation — West
CTFR-based
Northern Europe: Denmark, Finland, Norway, Sweden
Western Europe: Belgium, England & Wales, France, Netherlands
Overseas English-speaking countries: Australia, Canada, New Zealand, United States
German-speaking countries: Austria, Switzerland, West Germany
Fluctuating CTFR (early 19th c. 4-5 CTFR):
Decline between 1880 - 1931 to 1,8-2,4 CTFR
Baby boom: cohorts born in the 1930s, 2,2-3,6 CTFR
1950 - 1960 cohorts: decline again to 1,6-2,2 CTFR
Explanation:
Lost children in the cohorts affected by Great Depression: sexual life stopped or reduced, no effective contraception (contradicts more general theory and the European marriage pattern)
Employment, housing
Mid-20th century prosperity is the cause of the baby boom (but others mention how it intersects with the persistence of certain morals, no female employment, no extranuptial birth, etc.)
Second phase of decline:
gender revolution? Women in work but household distribution of labor is uneven.
Prediction (& partial proof) of reversal: gender equality will lead to more time, less stress, more children (up to the recent decline it was more or less detectable in TFR data too).
DTM Variation — Southern Europe
Greece, Italy, Portugal, Spain
From 5 CTFR to 3,5 CTFR between 1850 - 1990
Later plateau in the 1920 - 1930s cohort
Decline restarts with the 1940s cohort to continue unabated
Explanation:
Specifities compared to Western Europe:
Patriarchy
High young adult unemployment
High housing costs, custom of living with parents
CEE
Aligned with West until 1945 (1910s cohort)
Socialism: full employment with industrialization, pro-natalist ideology, lack of personal freedom — stable early universal childbearing: job search, housing, health care, leisure, free education, etc.
Post-socialist transition: all of that is lost
DTM Variation — Central and Eastern Europe
Central Europe: Czech Republic, Hungary, Poland, Slovakia
Southeastern Europe: Bulgaria, Romania, Serbia
Eastern Europe: Belarus, Russia, Ukraine
Pre-1914 cohorts with two pathways:
Russia high CTFR, Czech, Slovak similar to Sweden
Later in CEE no bounce back (Stable CTFR around 2)
Decline starting with the 1960s cohort (crisis of state socialism and transition?)
DTM Variations — East (and Southeast) Asia
Hong-kong, Japan, Singapore, South Korea, Taiwan
Most countries moderate high CTFR (Korea, Singapore, Taiwan, Hong Kong) — rapid decline starting with 1940s cohort
Japan: Earlier decline, 1930s cohort CTFR 2, but decline resumes with 1960s
Explanation:
Fast economy growth, but only from mid-20th c. (except Japan), rapid growth radical changes, intense labour demand, co-exist with patriarchy and few welfare provision — delayed childbearing (Today: the digital disease?)
Where does the DTM Variations leave us?
What is cultural:
Patriarchy
Intentionality (Caldwell, Coale)
Constantly failed predictions
Migration
Difficulties of definition, coverage and techniques of data collection and reporting
Main destination: overseas
Emigration statistics // Immigration statistics
How does it affect fertility?
Emigration statistics
A total population flow to overseas 1821 - 1915: approximately 45+ millions (majority from Europe, the remainder from Asia)
Increasing tide of population movement volume through the century
Notice the spatial pattern and timing!
Asiatic & Tropical Migration
African slave trade was growing in the first decades of the 19th century (despite legal abolition)
The abolition of slavery, however, resulted shortage of labor in tropical plantation economies that resulted Asiatic migration (from India & China mostly, from Japan after 1885)
Main destinations of Asiatic migration:
West Indies
South Africa
Mauritius
Australia

Emigration from Europe, 1821-1915 I.

Emigration from Europe, 1821-1915 II.

Destinations of Immigration