Lecture 5: Rising Female Labor Force Participation & Employment
 Call Kai
 Learn
Learn Practice Test
 Spaced Repetition
 Match
Match Flashcards
 Knowt Play
1/15

There's no tags or description
Looks like no tags are added yet.
Name | Mastery | Learn | Test | Matching | Spaced | Call with Kai | Chat |
|---|
No analytics yet
Send a link to your students to track their progress
16 Terms
Topic 1: Labor Force Participation Trends for Women
What are the two overarching themes that determine women’s labor force participation?
a) The value of their market time
b) The value of their non-market time.
What are the eras through which we analyze female LFP?
a) WW2 era (1939-45)
b) Baby Boom years (1946-1960)
c) Quiet revolution (1960-1980)
d) 1990’s and 2000’s)
WW2 Era (1939-1945) list market (a) and non-market factors (b).
a) men entered armed forces, demand for female labor increased, better paying jobs available for women, social support for women working.
b) lower births date during war years,daycare centers opened
NOTE: post ww2- female labor force participation fell again but remained high than pre-war times.
Baby Boom Years (1946-1960)
Steady rise in female LFP
a) Increasing real wages, higher educational attainment made women in their mid 30s more desirable workers due to occupational qualifications.
b) birth rates rapidly rise.
Quiet Revolution (1960-80)
Sharp increase in female LFP even for mothers with small children
a) market wage for educated women, and education levels on average for women increased, career gaps more costly and male earnings stagnate.
b) postponement of marriage and babies (Claudia Goldin- the power of the pill), increased divorce rates.
1990s & 2000s
LFP of married mothers slowed and leveled off in the mid 1990s, while LFP of single mothers increased rapidly
In the 90s and 2000s why was there a rise in single mothers LFP?
The government instilled programs to make labor force participation more feasible for single mothers.
PRWORA (1996)- career readiness, transportation, childcare.
EITC expansion- refundable tax credit for low income people reducing tax liability.
How was the slowing LFP or married women understood? Was this understanding correct?
Improved opportunities of the spouse explained very little.
2 Recessions: dot-com bubble burst (2000-2002), and Great Recession (2007-2008) should not have differential effects on single versus marries women.
Opt our revolution? some reports claimed that college educated mothers were dropping out of the labor force at record number after the Census Beareu reported a drop in female LFP (1998~ 58.7%, 2003~54.6%, and 2006~56%). However this opting out was a marginal phenomenon amongst very high income families only.
Key Factors affecting LFP of women on the Supply and Demand Side in Sum

TOPIC 2: Labor Force Participation~ Men
List 2 trends that are currently shifting labor force participation for men.
Men enter the workforce at later ages than they used ot as their participation in high education has increased.
Men retire at earlier ages than they used to as private-pension schemes and social security make it possible.
Decline in participation rate of prime working age men (25-54) due to a) falling demand of less skilled workers b) men “opt out,” when wives are more likely to keep working.
TOPIC 3: Claudia Goldin- The General Model of Supply and Demand (UGG, Chp. 5 & 6)
Supply and demand in the labor force and shift factors
Shifts in supply: immigration, population growth, tastes, and preferences.
Shifts in demand: technology, output price.

Goldins Key Model
The graph below shows a schematic representation of the market for married women’s labor from 1890 to 1980.
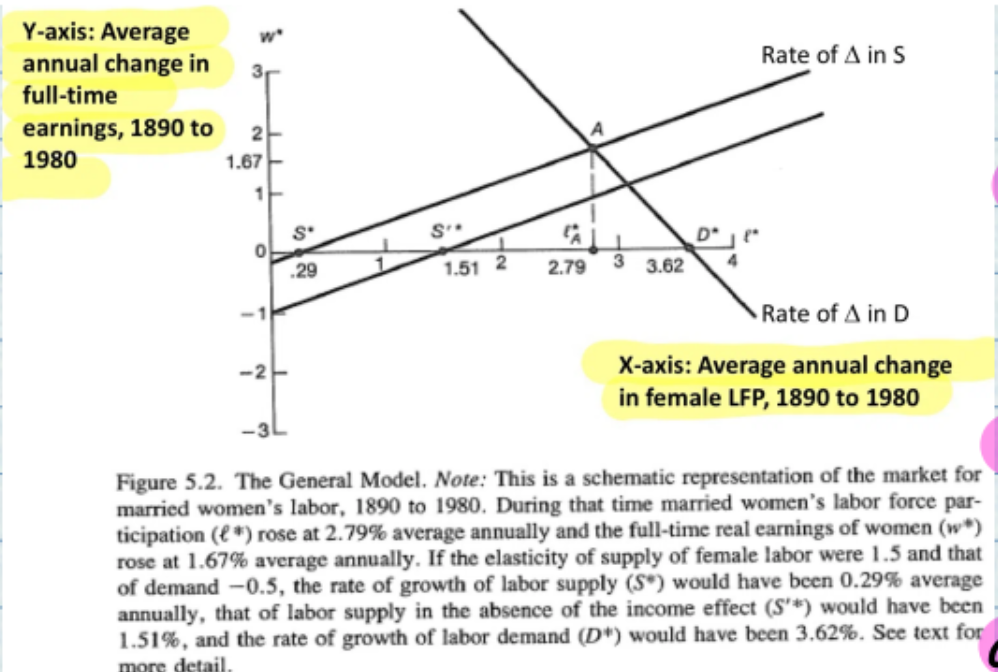
Core Conclusions of the Model
Key Conclusion: Slow progress in women’s LFP during the 19th and 20th century. Dividing the period into 3 we observe that:
a) 1890-1930- education shift, and shift in s social norms, fertility down and number of children per female lowered
supply curve shifts very fact
little role for demand facotrs
SE up, IE down.
b)1940s-1960s- ww2
demand shift much faster than supply
supply shifted backwards (as Ym was growing)
IE> SE
C) 1960s-1980s- the power of the pill
both demand and supply increased
demand effect was muted due to low elasticity of Labor supply meaning women were not responding to wage increases.
the power of the pill- FDA approved the pill in 1950. Only marries women could obtain it or single women with their fathers permission. AS access to birth control became more widespread (around the 1970s), age of first marriage and pregnancy became delayed.