AP Psych- Unit 0: Research methods
 Call Kai
 Learn
 Practice Test
 Spaced Repetition
 Match
 Flashcards
 Knowt Play
1/62

Earn XP
Description and Tags
Quiz: October 15/16 thursday and friday
63 Terms
3 elements of scientific attitude
Curiosity
Skepticism
Humility
Critical thinking
Not accepting things at face value and instead pausing to ask questions and examine info before making a conclusion
Challenges common sense?: By examining undesired assumptions, cultural myths, and mental shortcuts
Scientific Method: Theory
A hunch that organizes info and predicts behavior
Scientific Method: Hypothesis
is it falsifiable? proven or dis-proven through study
Scientific Method: Operational Definition
Concepts with precise procedures or measures measurements of the variables
EXAMPLE: rate attractiveness 1-10
Scientific Method: Peer Review
Additional insight / academic oversight
Scientific Method: Falsifiable
Confirmed or refuted
Scientific Method: Replication
Reliability grows if study can be repeated using methods
Theory will become valid if replicated
Descriptive methods
Describes behaviors, often using case studies or naturalistic observations
Case Study
In-depth look into background and story
typically unique/atypical cases that cannot be generalized to population
Naturalistic Observation
Just observing without interacting or informing who/m is being observed about the study
problem: does not tell you why behavior is happening (3rd variable)
Hawthorne effect
When you know you’re being watched, your behavior changes
Correlation
The measurement of strength of a relationship, its used to make a connection of how well A predicts B
Correlation does not mean causation!!!!
Correlational: Research tools
Survey
Wording
Random sampling / assignment
Meta-Analysis
Take info from multiple studies to back up your hypothesis
Survey
Correlational method that looks at many cases at once
can have bias
Social Desirability bias
Hides insides peoples normal habits and unconscious thoughts because if they look better to others is more important than the truth to them
Hindsight Bias
“I knew it all along” after being presented the facts and answers
Leads to overestimating our intuition
Confirmation Bias
Accepting an answer because it confirms what we want to hear, not what’s true.
Overconfidence
Hindsight bias can lead to an overestimate of our intuition (gut feeling)
Self-report bias
Introduces inaccuracies when participants provide subjective or distorted info instead of objective measurements
Experimenter Bias
occurs when a researcher's unconscious expectations, beliefs, or desires accidentally influence the outcome of a study
To prevent? →Double-blind procedure
Sampling Bias
When people or items chosen for a study doesn’t properly represent the wider target population
ruins generalizationability
Convenience sampling
When the researcher uses a sample that is nearby instead of equal opportunity for total population to participate
Representative sample
Random and equal opportunity for population to be apart of the study
Population
Entire group that’s being generalized/ studied
Sample
Smaller, manageable subset of a population that is being studied
Experimental methodology
Used to establish cause and effect relationships between variables
Non-experimental methodology
Documents natural behaviors, characteristics, or conditions as they naturally exist
Correlation
The measurement of strength of a relationship. Used to make a prediction on how well A predicts B
Correlation coefficient
Scale of -1 to 1 with 0 being no correlation
Scatterplot
Best used for correlational research
+, - or 0
Problem: Directionality
Strong or weak/ Positive or negative
Problem: 3rd variable (confounding)
Correlate with both the IV and DV → creates a false or distorted cause and effect relationship
Problem: Regression towards the mean
The tendency for extreme high or low scores or measurements to move closer to the average (mean) when measured a 2nd time
Independent variable
What’s being changed
Dependent variable
What’s being measured
Experimental group
Patients that do receive treatments
Control group
Patients that don’t receive treatments
Single-blind procedure
The participants don’t know who is receiving treatment
Double-blind procedure
The researcher and the subjects’s do not know who’s receiving treatment
good way to avoid experimenter’s bias
Placebo and the Placebo effect
Fake treatment that resembles actual treatment
used as a control variable and test confounding variables
Quantitative
How much/ to what extent
numerical and measurable
Qualitative
Categorical, why or how?
not as generalizable
Ethics: Informed consent
Legal and ethical requirement that a person fully understands and voluntarily agrees to a medical treatment, procedure, or research study before it begins
Ethics: Informed assent
Individual’s affirmative agreement to participate in research or medical procedures when they are not legally old enough or capable of providing full informed consent
Ethics: Confidentiality
Requires researchers and therapists to keep participants' or clients' personal data and disclosures private and secure, sharing them only with authorized team members or with explicit consent
Ethics: Protect from Harm
An ethical guideline stating that researchers must shield participants from undue physical or psychological pain, discomfort, or danger during a study
Research Confederates
An actor or secret assistant working for the researcher who pretends to be an ordinary participant, bystander, or victim while following a pre-planned script
Debriefing
Researchers provide participants with a full, honest explanation of a study's true purpose, hypotheses, and procedures immediately after the experiment ends
Central tendency
A single statistical value that identifies the center point or typical score of a data set.
It helps psychologists summarize large amounts of research data into an easy-to-understand representative number.
Mean
Average of the data
Median
Middle datum (arithmetic average)
Mode
Data that occurs the most
ie: 66 77777777 5 999 8888
Percentile rank
% of scores or reference group that fell at or below an individuals score

Range
Low to high data (difference)
Standard deviation
How far the data is from the mean
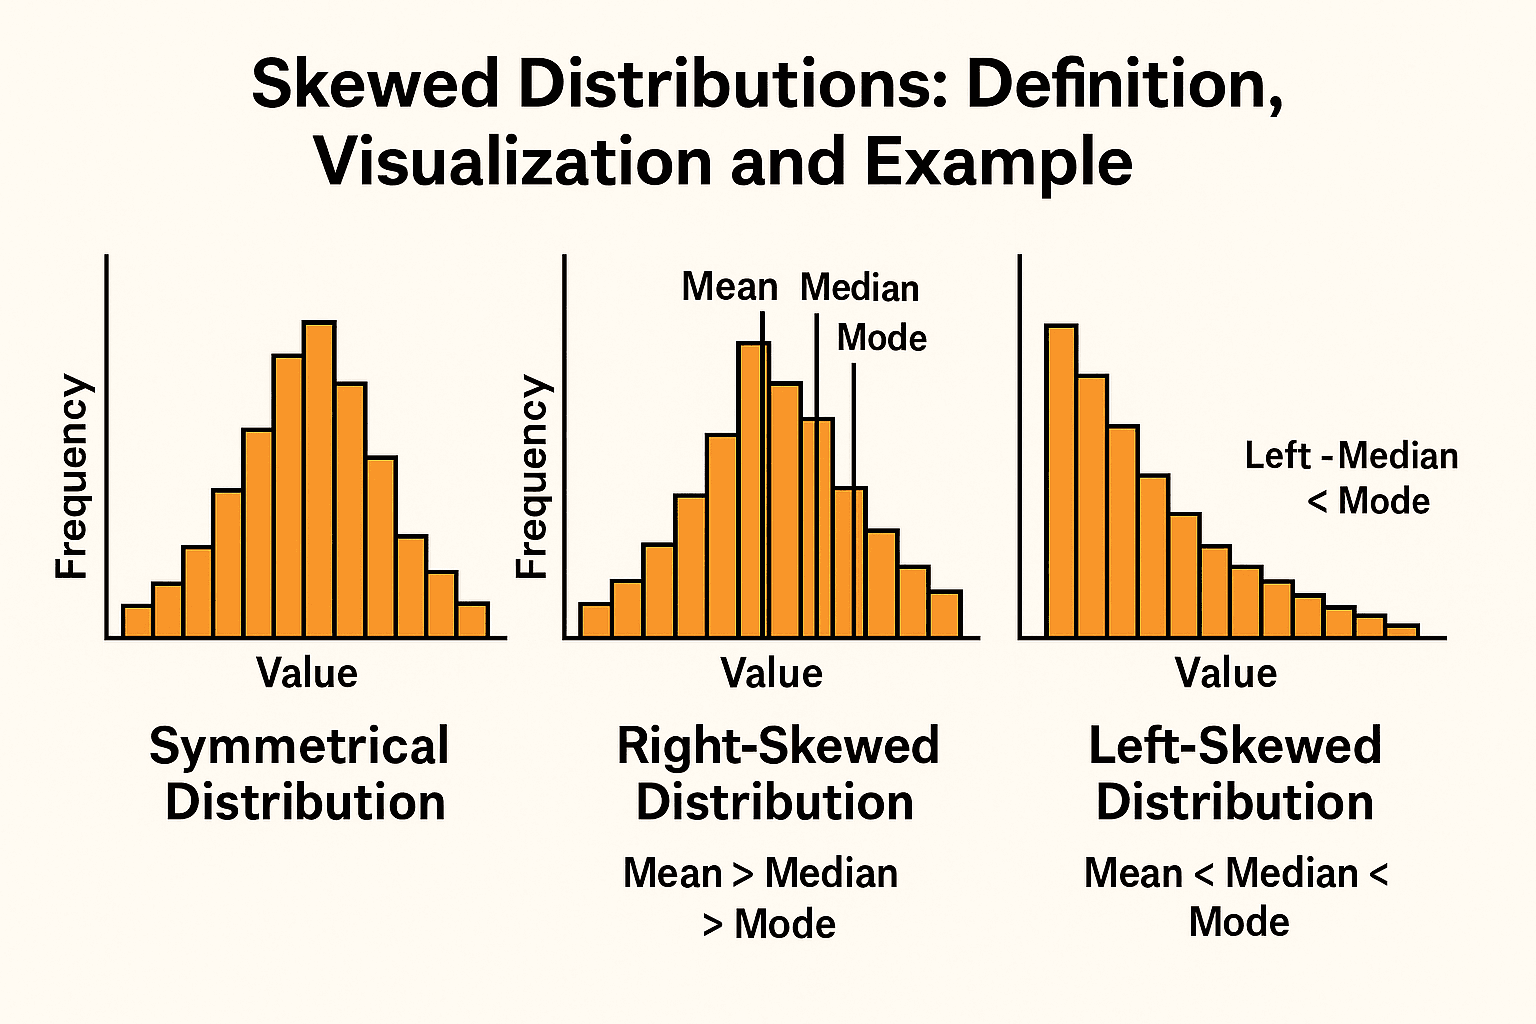
Skewed Distribution
Asymmetrical, meaning scores are not evenly spread out around the center, and one "tail" of the graph is longer than the other
Bimodal distribution
A frequency distribution or graph that has two distinct peaks (modes) instead of one

Inferential statistical
Uses data from a small group (sample) to make predictions, test hypothesis, or draw conclusions about a much larger group (population)
Statistical significance
the difference or relationship observed in a study is unlikely to have occurred by chance alone
p>< .05
Effect size
A quantitative measurement that states magnitude or strength of a relationship between variables or size difference between groups
When is it appropriate to apply findings to a population?
Random sampling
Representative group
Matched context