WEEK 9- Nutrition- Team sports
 Call Kai
 Learn
Learn Practice Test
 Spaced Repetition
 Match
Match Flashcards
 Knowt Play
1/57

There's no tags or description
Looks like no tags are added yet.
Name | Mastery | Learn | Test | Matching | Spaced | Call with Kai | Chat |
|---|
No analytics yet
Send a link to your students to track their progress
58 Terms
Which team sports were listed as popular in Australia?
- Soccer
- Basketball
- Australian rules football
- Netball
- Cricket
- Rugby league
- Rugby union
- Hockey
- Water polo
- Volleyball
- Softball
What are the key physiological characteristics of match play in team sports?
- Moderate-to-long duration: about 1-2 h
- Repeated bouts of high-intensity activity separated by rest or low-to-moderate activity
- Moderate-to-long match distances: about 8-15 km, depending on player position and game play
- Variable movement patterns, including:
- Walking
- Jogging
- Sprinting
- Jumping
- Lunging
- Tackling
- Energy is supplied by both:
- Anaerobic systems: phosphocreatine (PCr) and anaerobic glycolysis
- Aerobic system: carbohydrate (CHO) and fat
Key nutrition implication:
Carbohydrate intake is a priority because it contributes to both anaerobic and aerobic energy production.
What are the three main macrocycles used to periodise nutrition in team sports?
1. Pre-season
2. In-season
3. Off-season
Pre-season:
- Energy and carbohydrate requirements are generally highest
In-season:
- Energy and carbohydrate requirements are generally higher on match days than on weekly training days
Also consider:
- Tournaments with consecutive matches
- Recovery and timing challenges
- Travel
- Positional differences within a sport

What did the AFL workload data show about pre-season versus in-season running demands?
Total distance examples:
Early pre-season main training:
- 10,116 m (9,760-10,472)
Late pre-season main training:
- 11,751 m (11,300-12,202)
Precompetition:
- Training: 8,690 m (8,489-8,892)
- Game: 9,502 m (9,177-9,838)
Rounds 1-5:
- Training: 7,202 m (7,067-7,337)
- Game: 13,182 m (12,922-13,442)
Rounds 6-11:
- Training: 6,930 m (6,797-7,063)
- Game: 13,250 m (13,019-13,483)
Rounds 12-17:
- Training: 7,120 m (6,968-7,272)
- Game: 13,310 m (13,046-13,557)
Rounds 18-EOS:
- Training: 6,340 m (6,188-6,491)
- Game: 13,439 m (13,193-13,684)
Summary rows:
- Preseason: training 8,690 m; game 9,505 m
- In-season: training 6,340 m; game 13,439 m
Lecturer explanation:
Pre-season training distances are generally higher because training volume is used to build fitness before the competitive season.


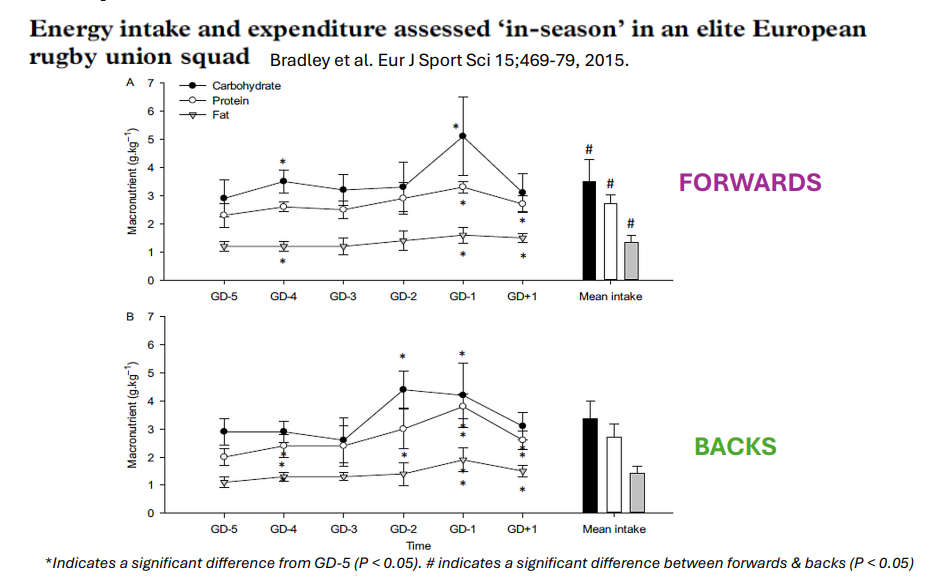
How did in-season macronutrient intake differ between forwards and backs in the elite rugby union study?
The study assessed carbohydrate, protein and fat intake from GD−5 to GD+1.
Key pattern highlighted:
- Backs increased carbohydrate intake about 2 days before game day.
- Forwards tended to increase intake closer to game day, about 1 day before.
The figure also reports:
- * Significant difference from GD−5, P < 0.05
- # Significant difference between forwards and backs, P < 0.05
Lecturer explanation:
This illustrates that nutrition should be periodised not only by day but also by positional demands.

How do 'train high', 'train', 'train low' and 'rest' differ in nutrition periodisation?
TRAIN HIGH
What:
- High carbohydrate intake
- Moderate-high protein intake
Why:
- Better performance
- Good recovery
- GI-tract adaptations
- Reduced RPE
- Prevention of overreaching
When:
- High-quality training
- Hard training days
- Match day
TRAIN
What:
- Moderate carbohydrate intake
- Moderate-high protein intake
Why:
- Good recovery between sessions
- Focus on healthy nutrition
When:
- Normal training days
- Resistance training
TRAIN LOW
What:
- Low carbohydrate intake
- Moderate-high protein intake
Why:
- Mitochondrial adaptations
- Increased fat oxidation
- Promote overreaching
When:
- Mostly pre-season
REST
What:
- Low carbohydrate intake
- Moderate protein intake
Why:
- Recovery
- Focus on healthy nutrition
When:
- Rest days
DIAGRAM ON SLIDE 9


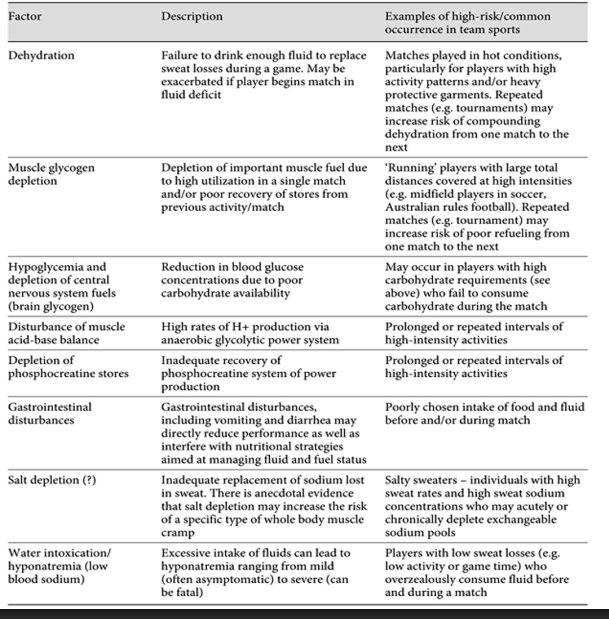
Which nutrition-related factors can contribute to fatigue in team sports?
- Dehydration
- Muscle glycogen depletion
- Hypoglycaemia and depletion of central nervous system fuels, including brain glycogen
- Disturbance of muscle acid-base balance
- Depletion of phosphocreatine stores
- Gastrointestinal disturbances
- Salt depletion (uncertain/questioned on slide)
- Water intoxication / hyponatraemia, meaning low blood sodium
What are ASNAP and PEAKS-NQ used for in athlete nutrition?
ASNAP:
- Accelerated Sports Nutrition Assessment Program
- Identifies gaps in nutrition knowledge and current dietary intake
- Can help tailor education in group and individual settings
- Intended for practical day-to-day sports nutrition use
PEAKS-NQ:
- Platform for Evaluating Athlete Knowledge in Sports Nutrition Questionnaire
Purpose:
Both can help identify gaps in athlete nutrition knowledge so education can be targeted.
What AIS Performance Nutrition HQ education topics were shown?
Australian Institute of Sport Performance Nutrition HQ modules included:
- Nutrition
- Introduction
- Nutrition fundamentals
- Supplements
- Training and Competition Nutrition
- Optimising hydration
DIAGRAM ON SLIDES 14-15
What are the main principles for fuelling team-sport athletes for optimal performance?
- Meet daily carbohydrate requirements.
- Increase carbohydrate intake in the 24-48 h before a match when appropriate.
- Use IOC guidelines as a framework.
- Individualise intake to the athlete.
- Treat timing as important as total intake.
Lecturer explanation:
Food choices, tolerance, role and timing should be personalised rather than applying one rigid plan to the entire team.
What did team-sport research show about carbohydrate availability and performance?
General:
- Few studies directly examine fuel demands in team-sport training or competition.
- Much of the research is in football/soccer.
Findings:
- Match glycogen depletion is associated with reduced distance run and reduced speed in the second half.
- 8 g CHO·kg⁻¹ BM for 48 h versus 4.5 g·kg⁻¹ BM increased intermittent running to fatigue at the end by about 1 km.
- 8 g·kg⁻¹ BM versus 3 g·kg⁻¹ BM in the preceding 48 h increased muscle glycogen by 38% and enabled 33% more high-intensity work.
- In ice hockey, 8.4 versus 6.2 g·kg⁻¹ BM during a 72 h recovery period produced 45% better muscle-glycogen restoration and increased distance and speed.
- Exercise with low glycogen may enhance selected training adaptations: 'train low / compete high'.
What are the main goals of pre-event fuelling in team sports?
- Optimise muscle glycogen stores
- Restore liver glycogen, especially before early-morning games
- Prevent hunger
- Avoid gastrointestinal issues
- Encourage routine and structure
- Consider psychology and superstitions
Lecturer explanation:
Familiar routines are useful, but dependence on a specific 'lucky' food may become a problem during travel or when that food is unavailable.
What is the practical pre-event carbohydrate timing strategy shown in the lecture?
3-4 HOURS BEFORE — MEAL
- Timing is highly individual
- Aim for about 1-4 g CHO/kg BM
- More important for longer, high-intensity events
- Fibre, fat and protein content can affect GI comfort
1-2 HOURS BEFORE — SNACK
- About 1 g CHO/kg BM
WITHIN THE LAST HOUR
- Gels
- Bars
- Sports drinks
Also:
- Consider anxiety/nerves
- Include fluid, which may provide carbohydrate, electrolytes and water
Lecturer explanation:
Nerves can affect gastric emptying, making simpler or more liquid foods useful for some athletes.
DIAGRAM ON SLIDE 21
Which carbohydrate-rich foods and drinks were suggested for pre-event fuelling?
CHO-rich foods:
- Pasta
- Noodles
- Rice
- Other grains such as barley, quinoa, rye and oats
- Breakfast cereal
- Bread, including muffins and crumpets
- Pancakes
- Yoghurt
- Fruit: fresh, tinned or dried
- Starchy vegetables:
- Potato
- Sweet potato
- Corn
- Baked beans and other legumes
- Tinned spaghetti
- Muesli / breakfast bars
Drinks:
- Milk, including flavoured milk
- Smoothies
- Liquid meal replacements
- Fruit juice
- Sports drinks
What special pre-event hydration strategies and risks were discussed?
Hyperhydration:
- Has shown positive results in some clinical trials
Potential disadvantages:
- Frequent urination
- Gut discomfort
- Hyponatraemia
- Increased body mass
Glycerol:
- Was on the WADA prohibited list
- Removed in 2018
Salt loading:
- Sodium-containing beverages can increase plasma volume
Stomach priming:
- Fluid bolus of about 5 mL·kg⁻¹ BM immediately before the event
- Approximately 300-400 mL
What pre-event cooling strategies were illustrated for hot conditions?
Heat-management strategies shown included:
- Cooling garments / cooling jackets
- Ice slurries
- Menthol-type cooling products
Lecturer explanation:
Menthol may create a perception of cooling without necessarily reducing body temperature, so strategies should be trialled before competition.
What are the main reasons to consume carbohydrate during team-sport exercise?
Carbohydrate during exercise may:
- Prevent hypoglycaemia
- Ensure adequate carbohydrate supply to working muscle
- Benefit central performance involving the brain and nervous system
- Provide possible immune-system benefits
Carbohydrate mouth rinsing can also produce central performance effects.
How may carbohydrate mouth rinsing improve short, high-intensity performance?
Key points from mouth-rinse studies:
- Performance benefits in short, high-intensity efforts can occur through a neural response rather than actual carbohydrate ingestion.
- A positive afferent signal may modify motor output.
- The effect is not only metabolic.
- Oral/taste-related cues are linked with emotional, cognitive and behavioural responses.
- Receptor cells may detect carbohydrate rather than simply taste.
- The exact mechanism remains unclear.
Lecturer explanation:
The athlete may rinse and spit out the carbohydrate solution yet still receive a central performance benefit.
What carbohydrate sources are practical during team-sport exercise?
Examples:
- Sports drinks
- Gels
- Lollies / confectionery
- Bananas
- Other familiar sports foods
Practical principles:
- For typical team-sport durations, the exact carbohydrate type is less important.
- Balance carbohydrate intake with fluid needs.
- Practise the nutrition strategy in training to reduce gastrointestinal problems.
What are the main goals of post-exercise nutrition after team-sport competition?
- Restore muscle glycogen stores
- Restore liver glycogen stores
- Replace fluid and electrolytes lost in sweat
- Support regeneration, repair and adaptation after catabolic stress
- Consider sleep quality after late games
Lecturer explanation:
Late-night competition can create tension between immediate recovery feeding and protecting sleep, which is itself an important recovery tool.
What practical factors can reduce food and fluid intake after a game?
- Reduced ability or interest in eating/drinking
- Fatigue
- Loss of appetite
- GI symptoms
- Emotional response to the result
- Limited access to suitable food at the venue
- Post-game commitments:
- Coach meetings
- Media interviews
- Cool-down activities
- Sport Integrity Australia testing
What are the practical post-exercise nutrition recommendations after >60 min of intermittent high-intensity exercise?
As soon as possible after exercise:
- 1.0-1.2 g CHO·kg⁻¹ BM
- 20-25 g protein
- Replace about 150% of fluid losses
Then:
- Follow with a meal about 2-3 h post-game
What rapid-recovery strategy is recommended when there are <8 h between long sessions or matches?
- Consume 1.0-1.2 g CHO·kg⁻¹ BM immediately.
- Then consume smaller high-GI carbohydrate servings every 15-20 min for the first 4 h.
- Replace about 150% of estimated fluid losses over the next 4-6 h.
- Use an electrolyte-containing beverage.
How do pre-game carbohydrate targets scale with athlete body mass?
At 1 g CHO·kg⁻¹ BM:
- 80 kg athlete → 80 g CHO
- 90 kg athlete → 90 g CHO
- 100 kg athlete → 100 g CHO
At 2 g CHO·kg⁻¹ BM:
- 80 kg athlete → 160 g CHO
- 90 kg athlete → 180 g CHO
- 100 kg athlete → 200 g CHO
Food examples shown:
- Footlong 6% Sub: ~100 g carbohydrate
- 6 Weet-Bix + milk + banana + honey: ~100 g carbohydrate
The slide separates foods into:
- Essential: performance benefit
- Optional: no performance benefit
DIAGRAM ON SLIDE 40
What pre-game eating schedule was shown for an 11:00 match?
07:00 pre-game:
- 6 Weet-Bix + milk + banana + honey
- ~100 g carbohydrate
10:00 top-up:
- Banana and/or muesli bar
- ~20-50 g carbohydrate
Lecturer explanation:
Because the game starts early, carbohydrate intake on the previous day also matters.
DIAGRAM ON SLIDE 41
What pre-game eating schedule was shown for a 14:15 match?
07:00 breakfast:
- 6 Weet-Bix + milk + banana + honey
- ~100 g carbohydrate
10:00 pre-game:
- Footlong 6% Sub
- ~100 g carbohydrate
12:00 top-up:
- Banana and/or muesli bar
- ~20-50 g carbohydrate
DIAGRAM ON SLIDE 42
What pre-game eating schedule was shown for a 19:15 match?
07:00 breakfast:
- 6 Weet-Bix + milk + banana + honey
- 100 g carbohydrate
10:00 morning tea:
- 1 slice toast + baked beans
- 65 g carbohydrate
12:00 snack/lunch:
- 2 cups pasta
- 100 g carbohydrate
15:00 pre-game:
- Footlong 6% Sub
- 100 g carbohydrate
17:00 top-up:
- Banana and/or muesli bar
- 20-50 g carbohydrate
DIAGRAM ON SLIDE 43
What carbohydrate options were illustrated for warm-up and match breaks?
Warm-up options shown:
- Pikelets
- Sports drinks
- Ice slushies
- Bananas
- Energy gels
- Lollies / confectionery
- Other sports nutrition products
Match-break examples:
¼ time:
- Lollies
½ time:
- Sports drinks
- Energy gel
- Pikelets
- Bananas
- Lollies
- Ice slushies
- Other sports foods
¾ time:
- Sports drinks
- Energy gel
- Lollies
- Ice slushies
- Sports nutrition products
Lecturer explanation:
Changing flavours and foods may reduce flavour fatigue and help maintain intake.
DIAGRAM ON SLIDES 44-45
What dehydration levels and performance effects were shown?
Water loss as % body mass:
2%:
- Impaired thermoregulatory ability
- Reduced muscular endurance
4%:
- Reduced muscular strength
- Reduced endurance time
- Heat cramps
6%:
- Severe heat cramps
- Heat exhaustion
8%:
- Heatstroke
- Coma
- Death
Lecturer explanation:
Performance effects may emerge around 2% body-mass loss, although individual sensitivity varies.
DIAGRAM ON SLIDE 49
How did dehydration affect cricket-specific skill execution in the study shown?
FIELDERS:
- 7% decrease in throwing speed
- 14-22% decrease in throwing accuracy
FAST BOWLERS:
- Up to 37% decrease in line-and-length accuracy
BATTERS:
- 2% slower over a single run
- 4% slower to complete 3 runs
DIAGRAM ON SLIDE 51
What are the core principles of hydration planning for team-sport athletes?
- Start each game or match in a well-hydrated state.
- Hot and humid environments make hydration more challenging.
- Multiple sessions can cause fluid deficits to accumulate.
- Fluid intake during exercise usually does not fully match sweat loss.
Lecturer emphasis:
Starting well hydrated is important because complete replacement during play is often impossible.
Which factors affect an athlete's fluid losses during exercise?
- Genetics
- Body surface area
- Environment
- Exercise intensity
- Aerobic fitness
Lecturer explanation:
Sweat rates can vary greatly between athletes and conditions; fitter athletes may sometimes sweat more because of a better-developed cooling response.
How should sweat rate be measured in practice?
- Weigh the athlete before and after training or competition.
- Use minimal, comparable clothing.
- Towel off residual sweat before weighing.
- Record fluid consumed.
- Record session duration.
Purpose:
Estimate exercise-associated fluid loss and sweat rate.
How was sweat rate calculated in the 70.5 kg soccer-player example?
Session:
- 1 h training
Pre-training mass:
- 70.5 kg
Post-training mass:
- 69.2 kg
Fluid consumed:
- 300 mL water
Fluid deficit:
- 1.3 kg ≈ 1300 mL
% body-mass loss:
- (70.5 − 69.2) / 70.5 × 100
- = 1.84%
Sweat rate:
- 1300 mL + 300 mL
- = 1600 mL·h⁻¹
DIAGRAM ON SLIDE 55
Netball player:
- 70.0 kg pre-training
- 68.6 kg post-training
- Drank 500 mL sports drink
- 90 min training
1. What is her percentage dehydration?
2. What is her sweat rate?
Correct answer not stated in the provided lecture material.
Lecturer explanation:
The exercise was included to practise calculating percentage body-mass loss and sweat rate, including conversion of 90 min to 1.5 h for an hourly rate.
DIAGRAM ON SLIDE 56
What sweat-rate values were shown for Australian rules football?
Male athletes:
Example 1:
- Sweat rate: 1.4 L·h⁻¹
- Ambient temperature: 12-15°C
- Relative humidity: 55-88%
Example 2:
- Sweat rate: 1.8 L·h⁻¹
- Ambient temperature: 27°C
- Relative humidity: 52%
Lecturer explanation:
Published values illustrate that sweat rate varies substantially with conditions and individuals.
DIAGRAM ON SLIDE 57
What sweat-rate values were shown for basketball?
Competition:
- Male: 1.6 L·h⁻¹ at 23°C, 41% RH
- Male: 1.6 L·h⁻¹ at 19°C, 36% RH
- Female: 0.9 L·h⁻¹ at 26°C, 60% RH
- Female: 1.0 L·h⁻¹ at 17°C, 58% RH
Training:
- Male: 1.4 L·h⁻¹ at 27°C, 34% RH
- Male: 1.0 L·h⁻¹ at 20°C, 24% RH
- Female: 0.7 L·h⁻¹ at 25°C, 43% RH
DIAGRAM ON SLIDE 58
What sweat-rate values were shown for cricket?
Male athletes:
- 0.5 L·h⁻¹ at 23°C and 65% RH
- 0.7 L·h⁻¹ at 33°C and 22% RH
- 1.4 L·h⁻¹ at 33°C and 30% RH
DIAGRAM ON SLIDE 59
What sweat-rate values were shown for football/soccer?
Competition:
- Female: 0.8 L·h⁻¹ at 26°C, 78% RH
- Male: 1.2 L·h⁻¹ at 25°C, 41% RH
- Male: 1.0 L·h⁻¹ at 10°C, 56% RH
Training:
- Female: 0.8 L·h⁻¹ at 30°C, 35% RH
- Male: 1.0 L·h⁻¹ at 25°C, 41% RH
- Male: 0.7 L·h⁻¹ at 9°C, 61% RH
Other male examples:
- 2.1 L·h⁻¹ at 33°C, 40% RH
- 0.8 L·h⁻¹ at 13°C, 7% RH
- 2.0 L·h⁻¹ at 13°C, 7% RH
- 1.3 L·h⁻¹ at 19°C, 55% RH
DIAGRAM ON SLIDE 60
What sweat-rate values were shown for netball?
Female athletes:
- Competition: 1.0 L·h⁻¹ at 22°C, 66% RH
- Unspecified intensity: 0.9 L·h⁻¹ at 16°C, 43% RH
- Training: 0.7 L·h⁻¹ at 28°C, 36% RH
- Training: 0.7 L·h⁻¹ at 19°C, 30% RH
DIAGRAM ON SLIDE 61
What sweat-rate values were shown for rugby union?
Male athletes:
- 2.2 L·h⁻¹ at 18-20°C and 18-20% RH
- 1.7 L·h⁻¹ at 21-23°C and 78-85% RH
- 2.2 L·h⁻¹ at 20-22°C and 74-82% RH
Position-specific examples at 24-25°C and 30-32% RH:
- Forwards: 2.6 L·h⁻¹
- Backs: 1.6 L·h⁻¹
Lecturer explanation:
Position can materially affect fluid loss, so team-wide hydration prescriptions may not suit every player.
DIAGRAM ON SLIDE 62
How was the Heat Stress Index interpreted on the example slide?
Example meteorological inputs:
- Air temperature: 34.5°C
- Relative humidity: 55%
- Wind: 17.0 km·h⁻¹
- Sunny-condition input also considered
Calculated risk:
- 7.4
Risk bands:
- 0-4: Play proceeds as normal
- 5-7: Extra breaks recommended
- 8-10: Extended extra breaks recommended
- >10: Consider suspension of play
Lecturer explanation:
Heat indices can guide decisions about additional breaks, delaying play or suspending activity.
DIAGRAM ON SLIDE 63
Why may team-sport athletes fail to drink enough during exercise?
- No fluid available at the venue
- Not thirsty
- Poor understanding of performance consequences
- Feeling uncomfortable when drinking during exercise
- Difficulty getting access to fluid during the event
- Concern about time lost
- Other athletes are not drinking
What practical strategies can encourage athletes to drink during training?
- Experiment with fluid type, amount and timing.
- Keep the stomach partly full.
- Drink about every 15-20 min.
- Typical amount per opportunity: 150-250 mL.
- About one 750 mL bottle per hour can be used as an initial guide.
- Keep a bottle available at all times.
- Cool fluids may be more refreshing and palatable.
Lecturer explanation:
These are starting points rather than fixed prescriptions; individual sweat rate remains important.
How does dehydration affect the gastrointestinal tract, and what adaptations occur with heat acclimatisation?
Dehydration:
- Can reduce gastric emptying rate
- Can increase gastrointestinal discomfort
Heat acclimatisation adaptations:
- Plasma volume expands
- Blood flow to muscle and skin improves
- Sweat glands hypertrophy
- Sweating begins at a lower core temperature
- Sweat becomes more dilute
- Sweat distribution improves
Also:
- Monitor body mass to minimise very large losses or gains.
How should hydration be organised during games?
- Allocate substitutes or other players to refill bottles.
- Bench players should continue drinking.
- Use timeouts and other breaks as drinking opportunities.
- Follow a planned drinking strategy.
What recovery-hydration practices were recommended after team-sport exercise?
- Full rehydration may take 24-48 h.
- Carry a drink bottle to work or school.
- Monitor urine colour.
- Monitor body mass.
- Use pre- and post-exercise body mass to estimate replacement needs.
- Slide guide: 1 kg body-mass loss ≈ 1.5 L fluid replacement.
- Avoid sitting in hot environments after exercise.
What practical pre-event hydration guidelines were recommended?
- Know the athlete's sweat rate.
- Monitor hydration status using:
- Urine colour
- Urine specific gravity (USG)
- Start each session well hydrated.
- Consider a pre-start fluid bolus:
- 5 mL·kg⁻¹ BM immediately before the event
- Approximately 300-400 mL
- Consume 300-600 mL with a pre-event meal.
- Consider 300-400 mL sports drink in the final 15-20 min before the event.
Which tools or methods were shown for assessing hydration status?
Methods illustrated included:
- Refractometer for urine specific gravity
- Hydration-monitoring app / mobile tracking
- Skin patch for sweat-electrolyte assessment
- Body-mass scales
Lecturer explanation:
Different tools assess different aspects of hydration and sweat loss.
DIAGRAM ON SLIDE 70
What simple self-monitoring signs can an athlete use to judge hydration status?
Self-monitoring signs:
- Urine colour
- Urine volume / frequency
- Physical symptoms
- Thirst
- Body-mass changes
The slide emphasised three overlapping practical checks:
- Thirst
- Urine colour and frequency
- Body mass
Lecturer explanation:
Using several signs together is more informative than relying on only one.
DIAGRAM ON SLIDE 71
How should the urine-colour chart shown in the lecture be interpreted?
Colours 1-3:
- Properly hydrated
- Continue recommended fluid intake
Colours 4-8:
- Increasingly suggest dehydration
- Athlete should drink more water
- Darker urine was associated on the chart with greater risk of cramping and/or heat illness
Important:
This is a screening aid rather than a stand-alone diagnostic tool.
DIAGRAM ON SLIDE 72
What is urine specific gravity (USG), and what threshold was used in the lecture?
USG:
- Urine specific gravity
- Used as an indicator of how successful the previous day's rehydration strategies have been
Threshold:
- <1.020 → HYDRATED
- >1.020 → DEHYDRATED
Interpretation:
- Below 1.020: fluid balance restored
- Above 1.020: fluid deficit carried over and rehydration is needed
Lecturer explanation:
First-morning USG can reflect the previous day's hydration status.
DIAGRAM ON SLIDE 73
What relationship between urine appearance and USG was illustrated?
USG examples shown:
- 1.027
- 1.020
- 1.015
- 1.010
General visual relationship:
- Higher USG samples were darker / more concentrated.
- Lower USG samples were paler / more dilute.
DIAGRAM ON SLIDE 74
What final hydration tips were given to team-sport athletes?
- Drink early in the session.
- Drink at every opportunity.
- Aim to keep fluid losses to about 1-2% of body mass.
- Replace sweat losses with about 150% of the fluid lost.
- Drink adequately throughout the day.
- Carry water bottles.
- Drink on waking.
- Drink with meals.
What hydration and snack strategies were recommended for flights and team travel?
Hydration:
- Stay hydrated
- Monitor urine on waking
- Carry a water bottle
Portable snacks:
- Trail bar
- Dried fruit and nuts
- Liquid meal replacements
- Fruit
- Cheese and crackers
Planning:
- Familiarise athletes with healthier options at airports and hotels
Lecturer explanation:
Do not rely only on airline or venue food; carry familiar food and fluid where practical.
DIAGRAM ON SLIDE 78
What 'food on the go' options were suggested for travelling team-sport athletes?
Examples:
- Poke bowls
- Burrito-style bowls
- Burritos
- Chicken with rice:
- Steamed rice
- Paella
- Fried rice
- Spicy rice
- Corn cob or salad
- Sushi
- Rice-paper rolls
- Burgers:
- Make-your-own
- Lean meat and salad
- Stir-fries with rice:
- Chicken with chilli and basil
- Sweet chilli
- Teriyaki chicken
- Beef with oyster sauce
What additional travel meal options were suggested on the second 'food on the go' slide?
Tex-Mex:
- Burrito with rice, beans, salad and meat
- Bowl with rice and/or beans, salad and chicken
Salads / lighter meals:
- Thai beef
- Vietnamese chicken
- Spicy prawn
- Chickpeas with roast pumpkin
- Pumpkin and couscous
- Rice-paper rolls
- Soups
- Beetroot and balsamic salad
What buffet-breakfast strategy was recommended for travelling athletes?
Principles:
- Aim for 3 food groups.
- Decide what you are going to have before filling the plate.
- Stick to one plate of food.
Examples:
- Muesli + yoghurt + fruit
- Toast + baked beans + tomato
- Fruit toast + yoghurt + banana
- Toast + peanut butter + banana + honey
- Smoothie with oats + milk + fruit
Lecturer explanation:
Select an amount and combination appropriate to the athlete's normal intake and upcoming training demands rather than sampling every buffet option.
DIAGRAM ON SLIDES 81-82