Weather and Climate Studies (Chapter 3)
 Call Kai
 Learn
 Practice Test
 Spaced Repetition
 Match
 Flashcards
 Knowt Play
1/31

There's no tags or description
Looks like no tags are added yet.
Name | Mastery | Learn | Test | Matching | Spaced | Call with Kai | Chat |
|---|
No analytics yet
Send a link to your students to track their progress
32 Terms
Statistical analysis
Interpretation and presentation of large quantities of data utilized to make sense of the vast amounts of data
Two types of statistics
Descriptive - data is described as given quantitively
Inferential - tests of hypotheses, making predictions, drawing conclusions
Descriptive statistics
A quantitative summary of the characteristics of a variable or data set
Mean
The sum of a set of values divided by the number of observations in the same set
Median
Middle value in a set of ranked observations
Equal number of values above and below it
Mode
Value that occurs the most frequently or appears most often in a data set
Ranger
Arithmetic difference between the smallest and the largest values of the group
Average deviation
Average amount of spread of the numbers from the middle value
Variance
Square of standard deviation
Provides a measure of the average squared deviation
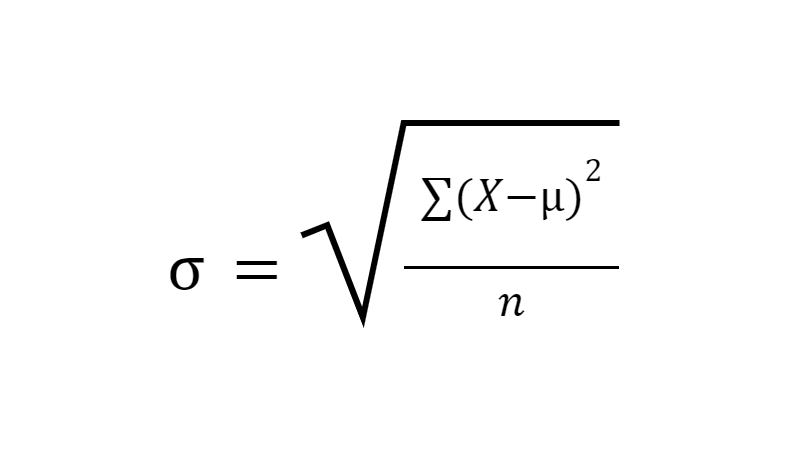
Standard Deviation
Common measure of the spread of the values about a middle position in a group
Distribution
Shape of a frequency graph that is repeatable
What is the most common distribution?
Normal distribution (bell curve)
Peak values
Standard Score
Mean is set to 0 and each deviation is set to 1
Frequency distribution
Describes how many of each value exists in the group within a simple set one-dimensional of numbers
What are common standards when creating graphs for data?
Axes scale linear or logarithmic
Two-dimensional data
Two values associated with each point, scatter plot used
Time series
Analysis accounting for climate observations taken over time that may have internal patterns, such as trends or seasonal variations
Two major objectives in climatic time series analysis
Understand variation in an ECV
Use understanding to forecast future changes in ECV behavior
Trend
General tendency of the values to increase or decrease over time for a series
Cycles
Regular fluctuations of similar magnitude and time span that can be identified in a data series
Recurrence interval
Statistical measure based on historic data representing the average reoccurrence of a similar event over an extended period of time
Commonly used with flood data
Climate normals
Tool used to characterize surface climate conditions at a specific location using just a couple ECVs
Geospatial climatology
A powerful, emerging method of study that examines spatial patterns of climate and their relationships with geographic features
Global positioning system (GPS)
A satellite-based geospatial location system that uses radio frequencies to provide geographic reference information for most places on Earth
Requires 4 GPS-specific satellites about the location’s horizon
Geographic Information Systems (GIS)
A system designed to capture, store, manipulate, analyze, manage, and present all types of geographical data
Allows for greater interactivity with users when used in climate mapping
Applied Climate Information System (ACIS)
Gathers archived climate data and presents it to users in an easier to read format
Parameter-elevation Regressions on Independent Slopes Model (PRISM)
A principal example of climate mapping which seeks to address elevation challenges in characterizing climate analysis over complex terrain
Regional climate analysis
Define clear geographic bounds to a spatial area and identify the intrinsic climatic characteristics that describe that area for a specific time
Dynamic climatology
Assumes that Earth’s climate system is governed by the well-known laws of physics and behaves accordingly
Applied climatology
A multi-disciplinary approach to describing, defining, interpreting and explaining relationships between climate conditions and weather-sensitive activities that focuses on how climatic variations affect humans and human interests
Koppen classification system
Empirical approach to organize Earth’s many regional climate zones that uses native vegetation as an indicator regional climate as well as patterns in mean annual and monthly temperature and precipitation
Spatial synoptic classification (SSC)
A hybrid classification scheme based on both manual and automated processes of identifying climate types