Plant Breeding & Genetics
 Call Kai
 Learn
 Practice Test
 Spaced Repetition
 Match
 Flashcards
 Knowt Play
1/91

There's no tags or description
Looks like no tags are added yet.
92 Terms
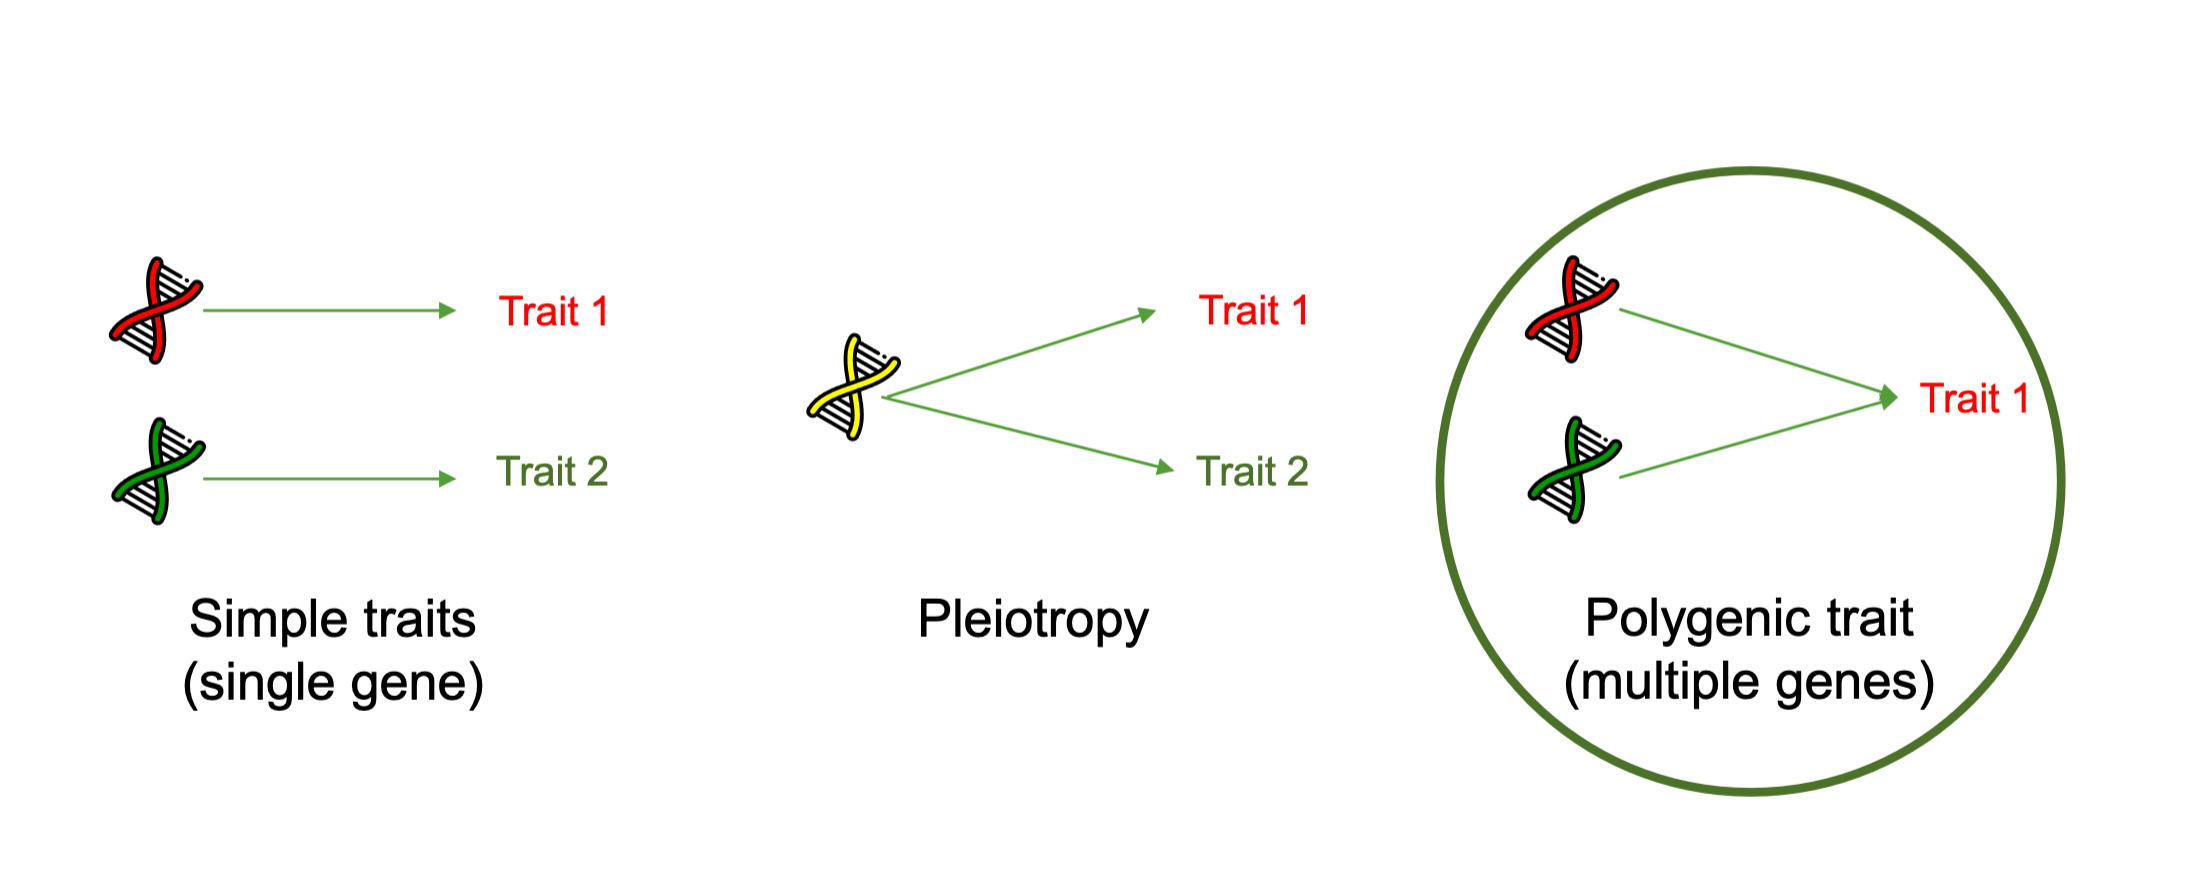
Simple vs polygenic vs pleiotropic traits.
Simple - single gene influences single trait.
Polygenic - multiple changes influence single trait.
Pleiotropic - single genes influence multiple traits.
Explain biparental analysis.
When the F2 progeny of two parents are analysed for genetic distance via recombination frequency, to study quantitative traits.
They display one reocmbination event.

Explain GWAS, what it answers and produces.
Genome Wide Association Studies.
Scans the entire genome of many different individuals to find genetic variations that are statistically linked to a trait of interest via historical recombination.
It answers the question “which region of the genome is associated with the trait of interest?” And tests markers throughout a whole genome, testing many SNPs to find statistical associations with a trait of interests.
It produces associated SNPs, peaks and genomic regions.

Explain GS, what it answers and it’s outputs, with reference to the genetic gain equation.
Genomic selection.
Predicts which candidate lines from a population are to have the best genetic merit.
For genomic selection to take place, a reference population that shares similarity to your candidate population must be both genotyped and phenotyped. Weighted values can then be found for all markers relating to a trait of interest, generating marker effect estimations. Using these values, the candidate population can be genotyped and the Genetic Breeding Values calculated before the phenotype is expressed. GEBVs and candidate ranking is produced.
A large, similar reference population will increase the prediction accuracy of GS.
Δ𝐺=(𝑖×𝑟×𝜎𝑔) / 𝐿
Where Δ𝐺 = genetic gain
𝑖 = selection intensity
𝑟 = selection accuracy
𝜎𝑔 = genetic variation (for that trait)
𝐿 = generation intervals
How does population structure affect GWAS?
Strong population structure can lead to biased predictions if not addressed, potentially causing false positives and false negatives in marker–trait associations - imbalances caused in allele frequencies that incorrectly link the allele to the trait.
For a GWAS to produce reliable results, the population should ideally consist of a random collection of unrelated lines. This is rare because most breeding lines share common parents. Plant populations often contain genetic subgroups created by ancestry, geographic origin, breeding history, or other characteristics. These shared origins create population structure, which can lead to false marker-trait associations if not properly accounted for.
Best practice involves evaluating population and family structure prior to genomic prediction.
Describe how QQ plots assist in fitting GWAS data with respect to population structure.
QQ plot stands for Quantile-Quantile plot, and it’s a crucial tool for assessing false positives and false negatives in a model.
In the beginning, data points (those with -log10(p) < 3) should align with the expected uniform distribution — this indicates variation due to genetic drift. Beyond -log10(p) = 3, while the expected values remain on the straight line, the actual observed values begin to deviate upward due to both drift and the presence of true associations. The upward “lift” at the end is exactly what we want to see — these are the SNPs of interest.
Therefore, a good GWAS result is reflected in a QQ plot that aligns with the diagonal initially and then curves upward at the tail. A QQ plot with this “lift” at the end is a good one.

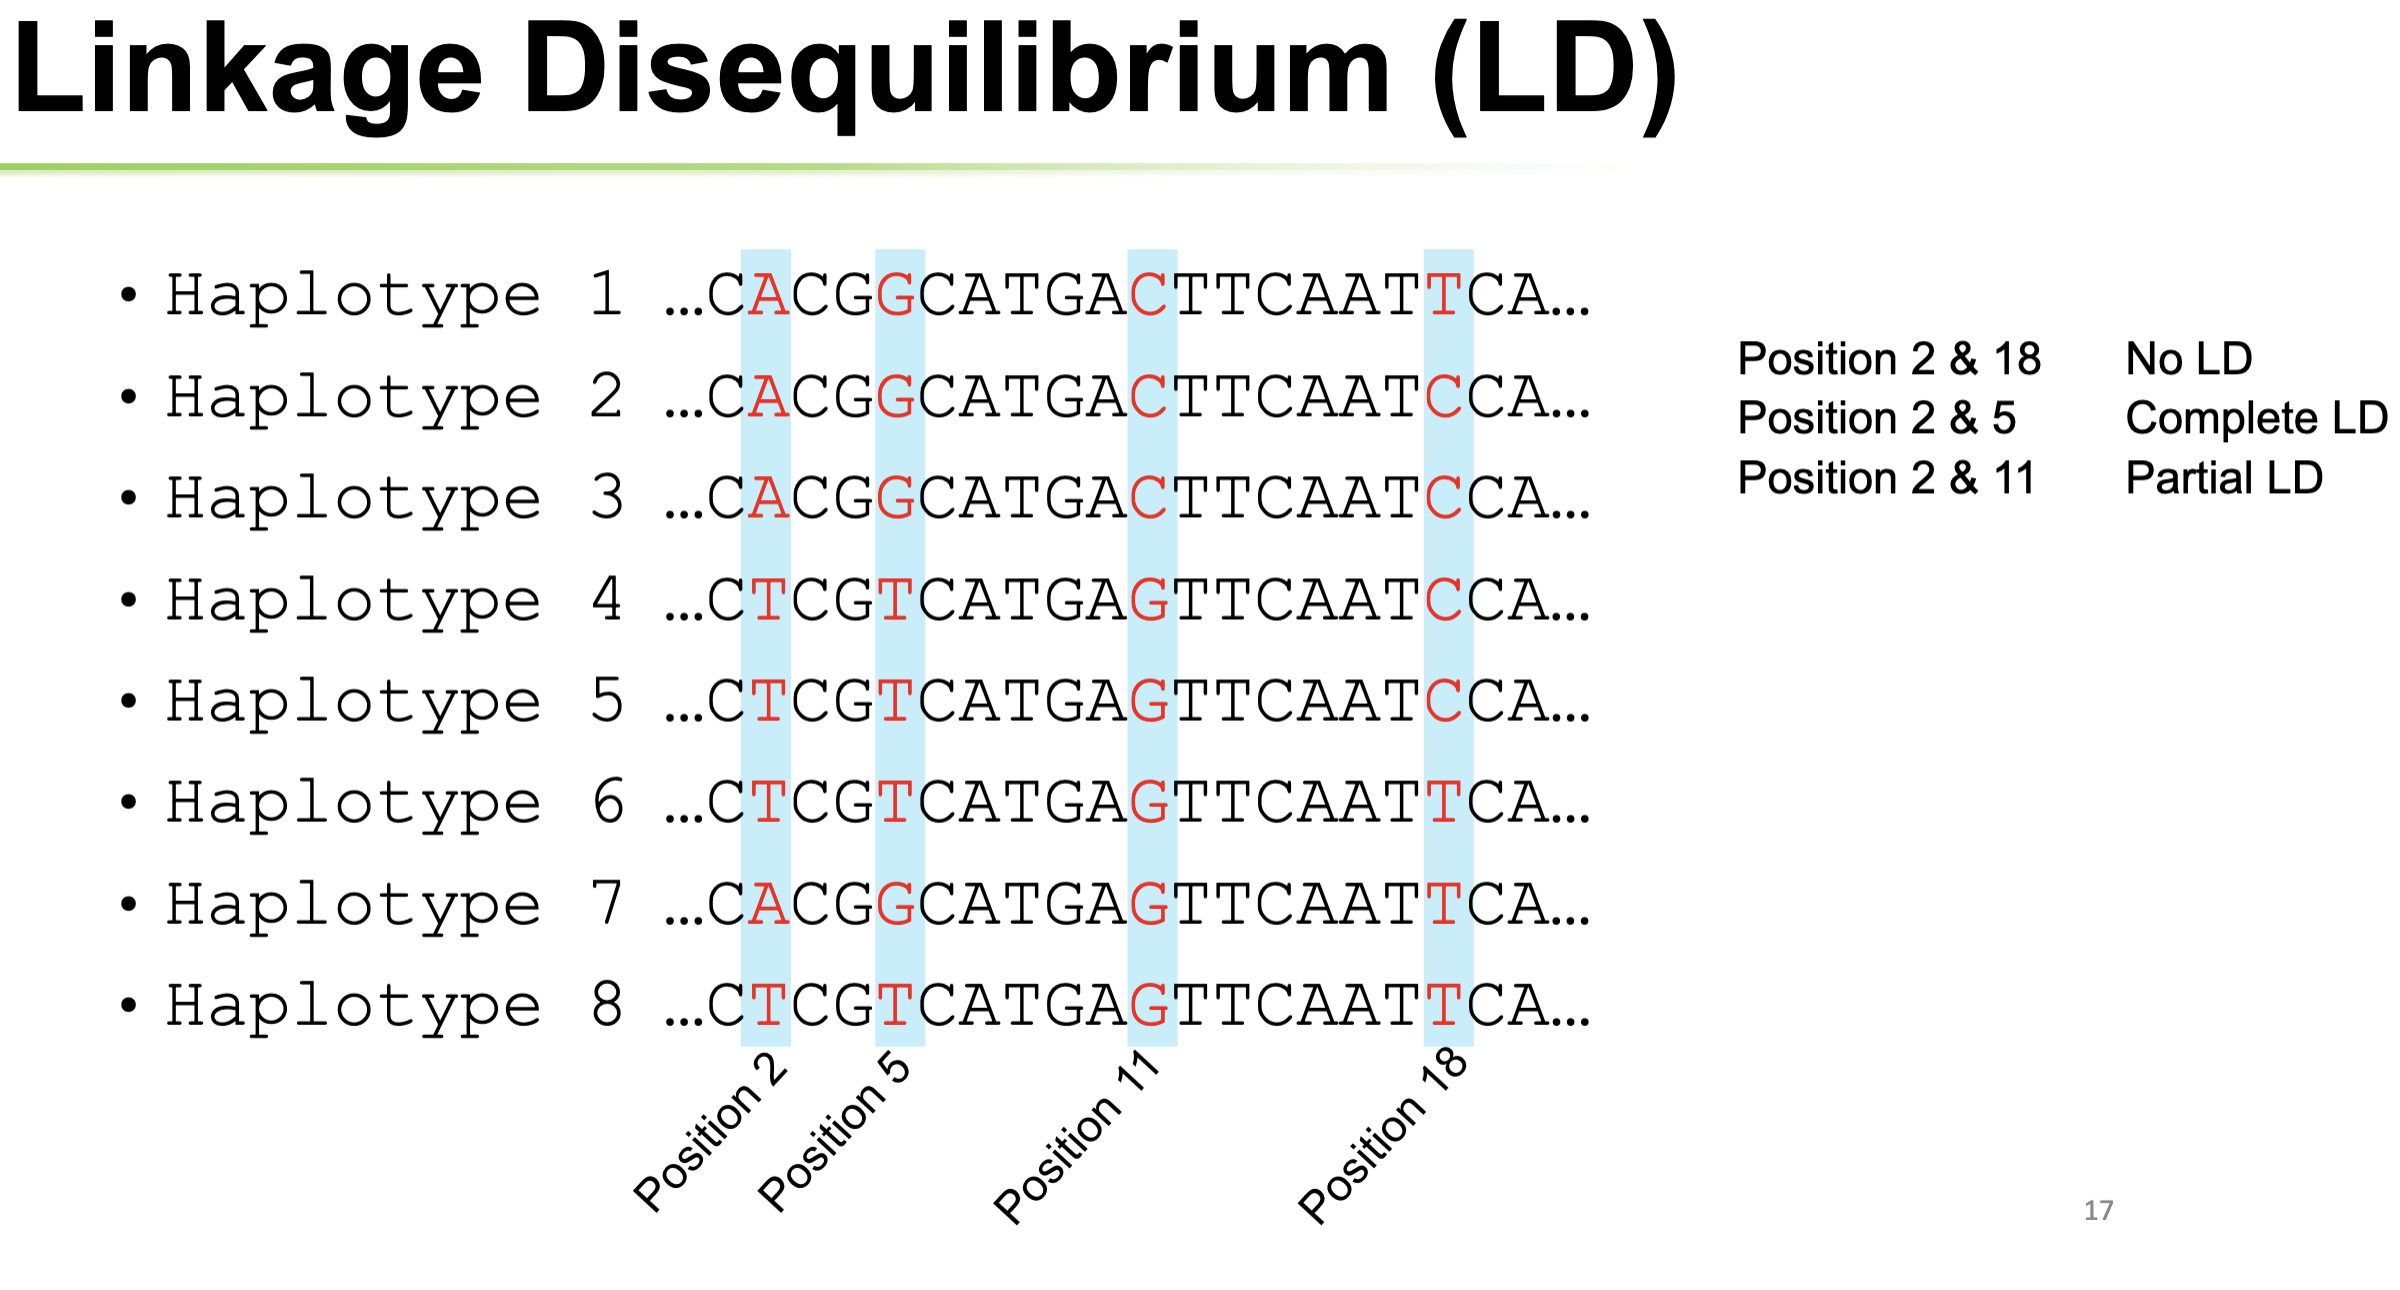
What is linkage disequilibrium & how is it measured?
→ Two variants will be in “equilibrium” if they segregated randomly
→ Two variants will be in “disequilibrium” if they segregated non-randomly
Not exactly the same as linkage:
• Linkage: between two or more adjacent loci on the same chromosome
• Linkage (dis)equilibrium: between any two or more loci anywhere in the genome
Can be measured numerically, where r² or D’ from 0-1.
0 - No LD/ == linkage equilibrium.
1 - Complete LD.
What factors affect Linkage Disequilibrium?
Increase LD:
• Population structure
• Decreasing the effective population size
• Selection
• Self-pollination
• Gene flow
• Genetic drift
Decrease LD:
• Recombination
• Increasing the effective population size
• Translocations
• Cross-pollination
• Mutations
Explain linkage disequilibrium blocks.
Displays relatedness of alleles to each other.
This is the fundamental for GWAS, and why GWAS does not find causal genes - as DNA is inherited in blocks rather than individual genes, the SNPs flagged by a GWAS is often just "tagging along" on the same haplotype block as the actual causal variant. Around 80% to 90% of GWAS-identified variants sit in non-coding regions of the genome, meaning they often regulate distant genes rather than the gene physically closest to the marker.

Explain slow/fast LD decay & LD decay plots.
LD decay: the rate at which the statistical correlation (non-random association) between alleles at different genetic loci decreases as the physical or genetic distance between them increases.
→ Slow decay (high LD) means that there are large LD blocks in the population
→ Fast decay (low LD) means that there are small LD blocks in the population
An LD-decay plot shows r² against the distance between variants.

Compare GS and GWAS.
GS:
→ Answers: Which candidate line is predicted to have the best breeding merit?
→ Predicts performance
→ Uses all markers together
→ Shortens the breeding cycle
→ Need to track inbreeding
GWAS:
→ Answers: Which region of the genome is associated with the trait of interest?
→ Discovers associated SNPS/loci
→ Tests markers individually
→ GWAS has higher power to detect quantitative trait loci compared to bi-parental mapping
→ Larger populations can increase the detection power
→ Need to control for population stratification
What is classical plant breeding?
Crossing and selection - conventional breeding based on Mendel’s laws.
Usually rate is 1 cross/hybrid seed per year.
What is the breeder’s equation?
As seen.

How does a mating system impact a breeding program? Give examples of both.
Mating (sexual reproduction) systems:
• self-pollination (Wheat, Barley, Canola, Tomato)
→ tends to homozygosity
• cross-pollination (Maize, Hemp, Sunflower, Broccoli)
→ maintains a high level of heterozygosity
• mixture of both
Affects:
• how easily breeders can make crosses and generate new genetic combinations
• the amount of genetic variation within a population
• the frequency of homozygous vs. heterozygous individuals
• which breeding methods are most appropriate
Explain inbreeding depression, and it’s prevalence in self & out crossing pollinated populations.
Self pollinated species - little or no adverse effect
• Over generations, natural selection has removed strongly deleterious alleles from the population
Cross pollinated species – moderate to high effect
• Recessive deleterious alleles "hidden" from natural selection in heterozygotes
Explain the pedigree breeding method.
Crossing two parent lines to combine desirable alleles from both parents and make a homozygous (inbred) line.
• Very widely used
• Superior genotypes are selected from early segregating generations
• Proper records of the ancestry (pedigree) of selected plants must be maintained in each generation
ADVANTAGES
• Can handle large numbers of recombinants with comparative ease - only progeny of superior plants are carried forward to the next generation
• Useful for selection of ‘readily identifiable’ characters in early generations
LIMITATIONS
• takes a long time, especially if each generation requires a whole year
• Very laborious – much screening work and careful record taking required

Explain the bulk population breeding method.
• Deliberate selection is delayed until a later generation (F5 or F6) as the population will consist mainly of homozygotes for most characters
• based on the theory of survival under competition under chosen environment to impose selection in a particular direction
ADVANTAGES
• simpler, more convenient, less laborious and cheaper than the pedigree method during the period to homozygosity
LIMITATIONS
• Bulk population usually possesses a very large number of undesirable recombinants so it is necessary to grow large numbers of plants once selection is practiced

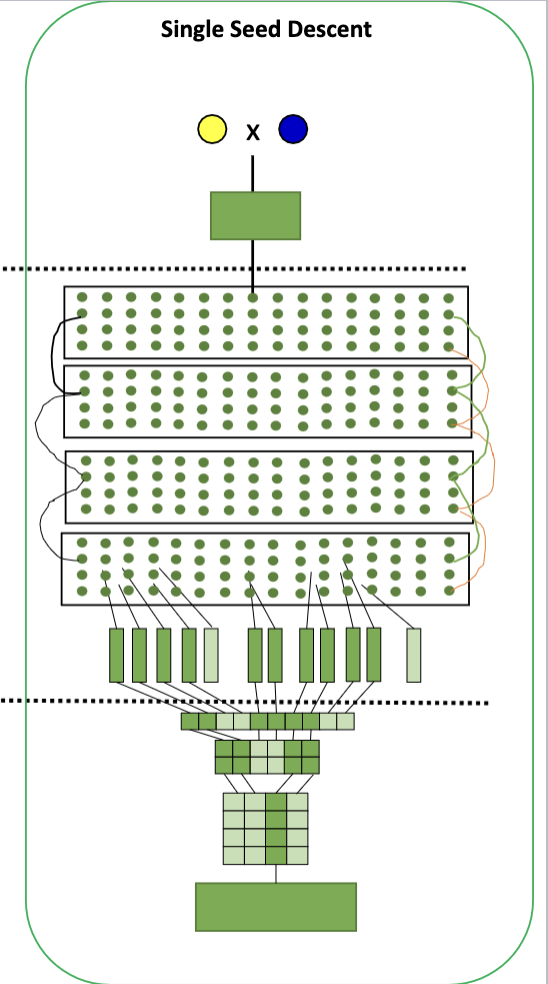
Explain the Single Seed Descent breeding method?
• Only one seed is used from each plant in the population as a parent for the next generation.
• Each homozygous line traces to a different F2 parent.
• Aim to get through early generations as quickly as possible: 2 to 3 generations per year in the glasshouse (to produce a set of homozygous recombinant lines from which to select traits)
ADVANTAGES
• Savings in time, space and labour during the period to homozygosity
• Works well with Speed Breeding
LIMITATIONS
• Natural selection has little influence.
• A poor seed/plant may prohibit every F2 plant from being represented in the subsequent population.
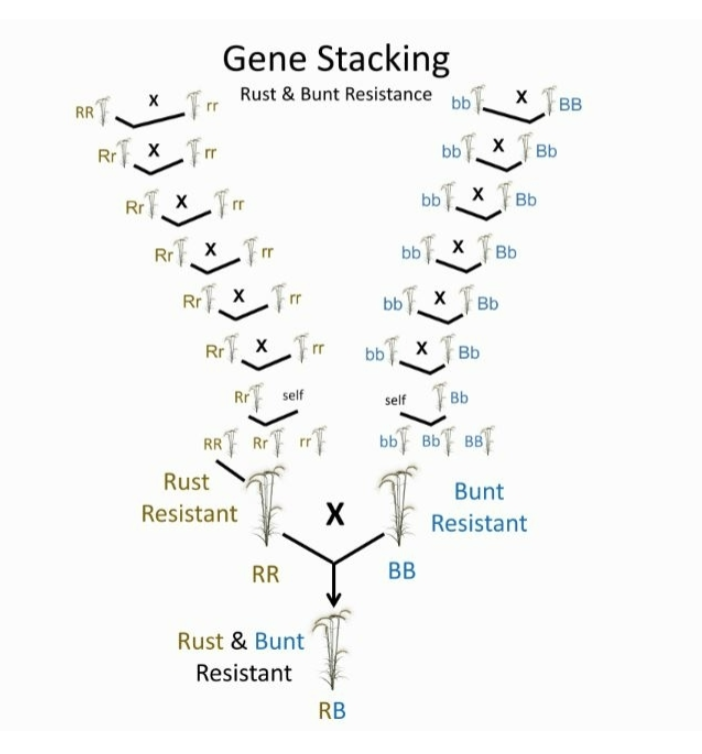
Explain the backcrossing breeding method? How can we gene stack?
Introducing one specific gene from a donor line into an already elite variety, then backcrossing to recover the genotype of the recurrent parent, except for the single gene from the non-recurrent (donor) parent.
Gene stack as shown - Backcross two separate lines, one for each trait, then self to fix desired alleles, then crossing the resulting lines with desirable traits together to get a plant variety with both desired traits.
Population converges to a single genotype, instead of breaking up into 2n homozygous genotypes as with selfing.
ADVANTAGES
• Addition of a specific trait to improve the cultivar
• All other traits will be the same as the recurrent parent
• Reduced need for field testing
LIMITATIONS
• The developed line will never be better than the recurrent (adapted) parent for other characters e.g. yield, quality.
• If donor is a wild relative there can be crossing barriers & risk of linkage drag
Explain how shuttle breeding accelerates genetic gain.
sends seed overseas for breeding when in an off season
Explain how speed breeding accelerates genetic gain.
controlled breeding under UV light/controlled conditions to reduce flowering time
Explain how double haploid technology accelerates genetic gain - with canola and wheat as example.
• 1 generation to homozygosity
• DH plants are produced by in-vitro culturing of the haploid (n) gametophytic cells (eg. immature pollen grains) using tissue culture
ADVANTAGES
• Time to homozygosity significantly reduced
• Savings in time during the period to
homozygosity.
• Uniform plant type and genetic make up - Achieve homozygosity at all loci
• Not seasonally dependent
• Reduction in time to cultivar release by 2-4 years
LIMITATIONS
• Screening and selection is still required.
• Labour intensive, skilled labour, energy costs
• Some species/varieties are more amenable to
DH technology than others.
Microspore culture (androgenesis) in canola
• Culture immature pollen (microspores) in vitro, then reprogram cells to form embryos and plants
• Chromosome doubling to obtain fertile doubled haploids
Embryo culture via wide hybridisation (wheat x maize)
• Pollinate wheat with maize pollen to stimulate haploid egg to differentiate into a haploid
embryo
• Use embryo rescue (tissue culture)
• Chromosome doubling

Explain heterosis?
Hybrid offspring exhibiting improved or increased function of any biological quality in a hybrid offspring (when better - Better Parent Heterosis)
=> Genetic basis not fully understood - possibly due to hybrids carrying more genes than their parents
=> specific to a trait
=> partially correlated to genetic diversity (more diverse/genetically distant parents == better heterosis)
Explain what a hybrid variety is., and its advantages and disadvantages.
Homozygous x homozygous producing a heterozygous offspring.
ADV:
- yield advantage
- genetic uniformity of F1
- improved abiotic/biotic resistance
- convenient method for combining desirable parental traits
DISADV:
- costly (seed + annual investment)
- reduction in heterosis for retained seed + potential segregation for undesirable traits
How are hybrids produced? What requirements are involved?
1) Self pollination to produce lines with good parent potential.
2) Test crossing: identify lines with positive heterosis to identify lines with good combining ability (not all F1 crosses result in an elite hybrid).
3) Production crossing: commercial production of F1 hybrid seed (expensive, labourious)
Biological requirements:
→ Presence of hybrid vigour (combining ability tested)
→ Elimination of fertile pollen in female parent
→ Adequate pollination by male parent
Practical requirements:
→ Need a program for hybrid seed production on a large scale.

Explain mechanial method/s for hybrid production.
emasculation by hand and pollination by hand
remove male flowers from female parent (eg. detassel corn) using machinery and allow natural pollination (e.g insect, wind) for seed production
Explain chemical method/s for hybrid production, and its possible issues.
gametocides: chemicals that inhibit the production of viable pollen or prevent pollen shed
Issues:
→ Incomplete pollen sterility can occur
→ Sensitive to timing & environmental conditions
→ Possible human health issues?
→ still need a source of pollen & method to pollinate the flower for seed production
Explain male sterility.
The inability to produce or to release functional pollen - due to failure to form or develop functional stamens, microspores or gametes.
→ Naturally occurring mutants of these crops have been found in wild types.
→ Can still set seed if cross pollinated
→ Results in a ‘female line’
Explain cytoplasmic male sterility.
A common type of male sterility controlled by genes in the cytoplasm (in mitochondria), which is maternally inherited so genes for male sterility in the mitochondria are transmitted only by the female parent.
Naturally occurring CMS mutants found in wild type species, each controlled by a different open reading frame in the mitochondrial genome.
Explain cytoplasmic male sterility, specifically in canola with regard to its issues and eventual solutions for the farmer.
CMS mutant found in radish (Raphanus sativus), a close relative to canola.
Ogura cytoplasmic male sterility was bred into canola in 1970s by crossing between species (intergeneric hybridisation).
‘Female’/CMS lines sown next to male lines in the field and introduce bees for pollination.
Now the most widely used, highly stable male sterility system in canola.
ISSUES:
→ Canola CMS hybrids didn’t yield much seed (unrestored hybrids) - the F1 plants inherit the CMS trait so are reliant on a pollen source & pollinator (bees)
→ Nuclear genes, termed ‘restorers of fertility’ (Rf) that could suppress the male sterile phenotype were also identified in radish
• these were bred into the male (pollen) parent, so F1 hybrids with restored fertility could be produced
SOLUTION/PROCESS
1. Foundation seed crossing block between line A (CMS/female line) and line B (maintainer, same nuclear genotype as A but with cytoplasmic fertility) to produce more line A (CMS/female line) male-sterile progeny seed, because the two lines have recessive fertility genes in nucleus and the A-line has CMS.
2. Hybrid seed crossing block between line A and the restorer line (Rf) to produce actual hybrid seed for commercial crops. The sterility-inducing effect of the CMS cytoplasm from the A-line isreversed, resulting in fertile hybrid seed
3. Hybrid seed is commercially produced, sold to growers. The plant has fertility restored so it will self-pollinated to produce seed for harvest. [NOTE this can take 2 years to bulk, under specific environmental and agronomic conditions]

What challenges are involved in wheat hybrids?
→ wheat has a small pollination window
→ produces few pollen
→ pollen is heavy
→ in hybrid seed production, a proportion of wheat in the field is male, which self pollinates and is discarded (25% discarded - only harvesting 75% of the seed msut make the yield improvement impressive)
Explain End Point Royalties and Plant Breeder’s Rights.
→ All major grain crops in Australia are now bred by commercial companies
→ Plant Breeder’s Rights protects:
—→ Farmers grow varieties under license conditions – they can usually keep the seed of new cultivars they purchase, but they cannot sell it to their neighbours.
—→ Returns to the developer are mainly through a royalty, either: on ‘planting seed’ sales, or through a royalty on production (an end point royalty)
→ for inbred crops such as wheat, barley, pulses, some canola seed can be retained, revenue stream for company from end-point royalty (EPR) (e.g. $4.00 per tonne)
→ for hybrids such as maize, sorghum, some canola seed is only used for one season (doesn’t retain performance), revenue stream for company from the sale of seed each season
What is transgenic breeding?
Developing a transgenic plant expressing a gene conferring a trait-of-interest. Then crossing the transgenic plant to an elite variety for new variety development
Why is transgenic breeding important for agriculture?
important tools for:
• COMPLEMENTATION - introducing a new gene resource
• OVEREXPRESSION - increasing gene expression may enhance the function
of the gene (e.g. increase salinity tolerance)
• GENE DOWN - decreasing gene expression
• GENE KNOCKOUT - eliminate the function of the gene
• ISOLATION - study gene function
• DIVERSITY - may widen the variability available for certain traits or allow new trait development
• gene pyramiding
What is gene transformation?
Changing the genetic make-up (genome) of a plant; adding a gene to the host plant genome and expression of the inserted gene to achieve an altered phenotype
In plant genetics:
- Agrobacterium tumefaciens-mediated
- Biolistic transformation
Explain the origin of gene transformation in nature.
*Found naturaly in sweet potato - bacterial DNA in genome !
Agrobacterium is a soil pathogenic bacterium that can transfer part of its DNA into a plants genome.
- Tumor inducing (Ti) or root inducing (Ri) plasmids carried by Agrobacterium (T-DNA) are transferred to plant cells. T-DNA carries a number of genes, important for the survival of Agrobacterium and the bacterial infection in plants
- After detecting plant molecules, Agrobacterium activates chromosomal genes (chv genes) and vir genes
- Chv proteins participate in Agrobacterium attachment to the plant cells
- Vir proteins assist in the cleavage and the transfer of T-DNA from the bacterial cell into the plant cell
- T-DNA also contains genes encoding plant growth hormones. When expressed in the plant genome, the overproduction of plant growth hormones in plants stimulates the development of tumor or root hairs.
- Some genes, located on the T-DNA, encode for enzymes important for the synthesis of unique amino acids, called opines. After T-DNA integration, the large crown galls in the plants provide Agrobacterium with this essential nutrient.

Explain the process of using Agrobacterium as a tool in plant transformation.
Editing Ti/Ri plasmids to insert GOI via RE digest, “disarming” its original function
T-binary vector = T-DNA, GOI and other components needed for selection, replication, and gene expression
Vir Helper Plasmid = carries vir genes
Floral dip transformation → plants grown to flowering stage, dipped briefly in a solution of transformed Agrobacterium containing sucrose and surfactant
Plants are maintained for several weeks until mature progeny seeds are harvested
Progeny seeds are germinated in the presence of selection agent to identify transformants
Note that Agrobacterium historically evolved to infect dicots - difficulty in editing monocots.

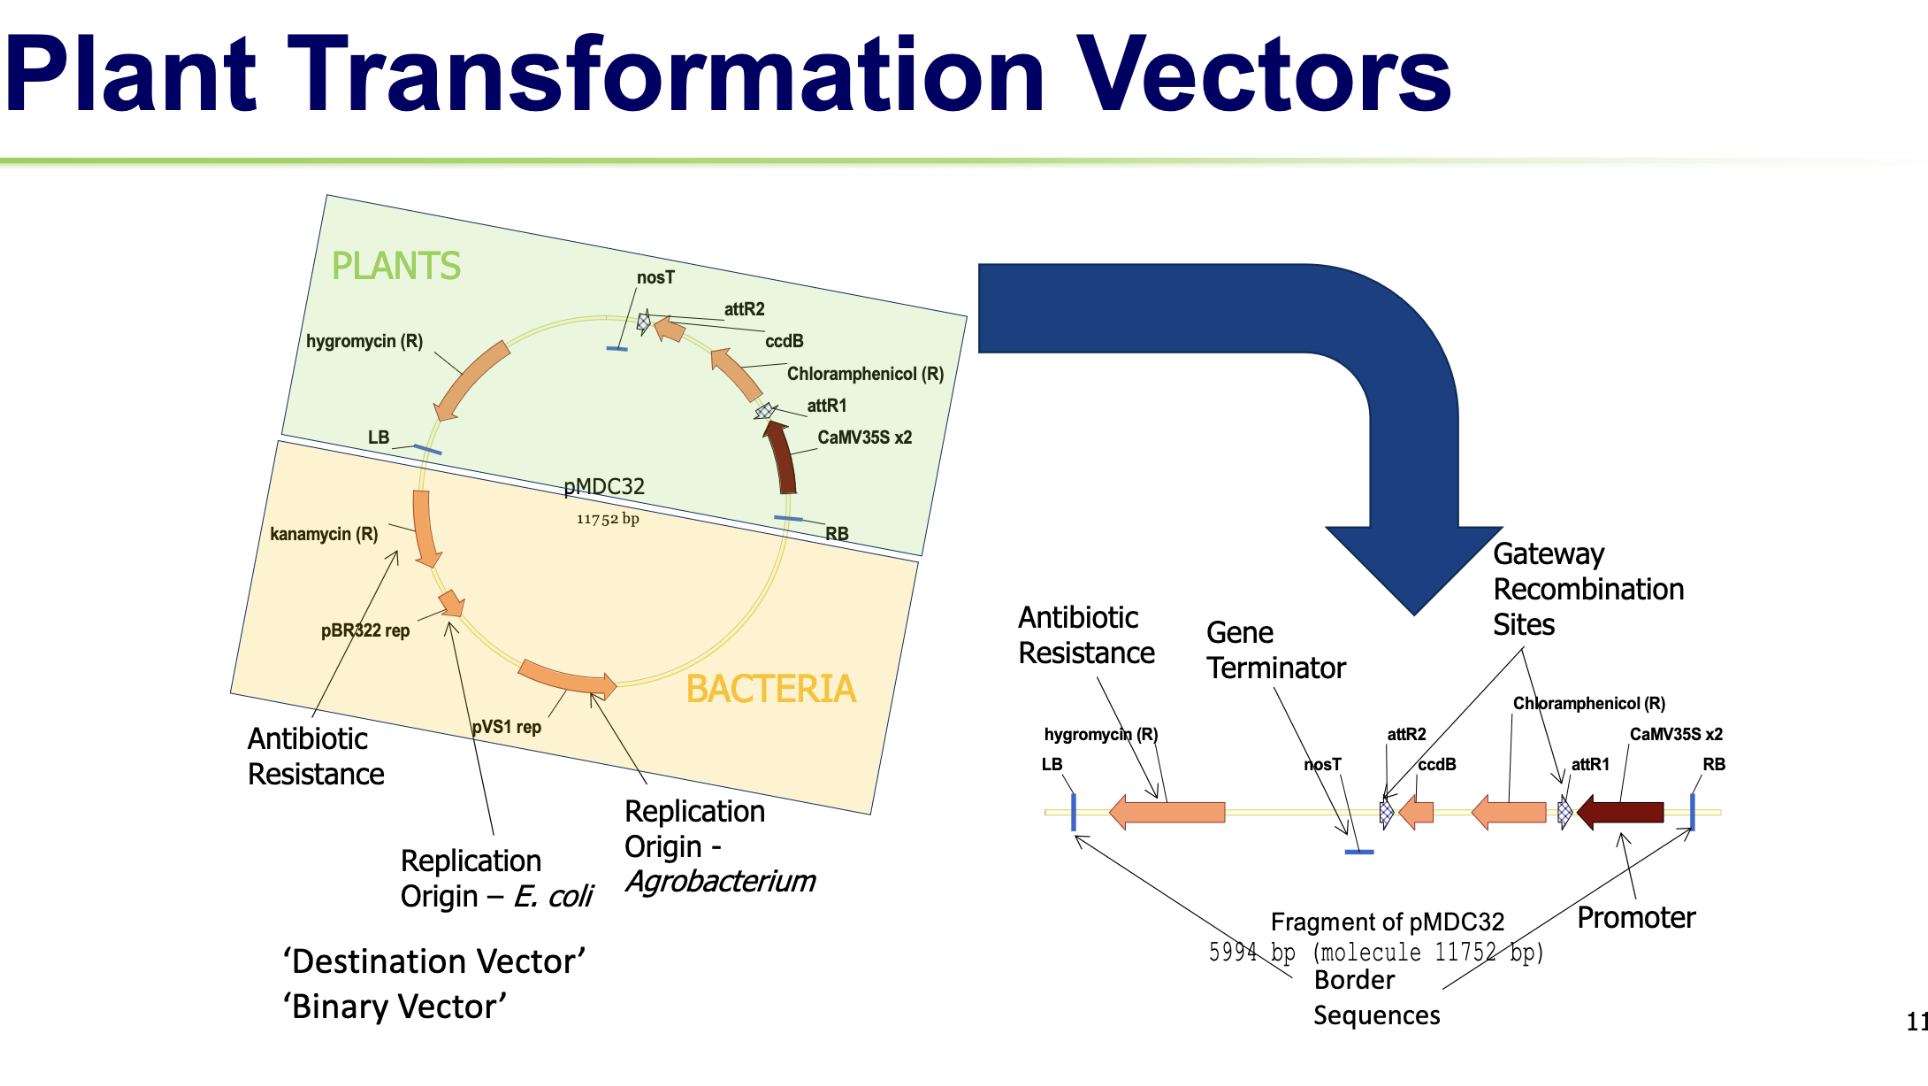
What are vectors? How can we integrate them into plant genomes?
A vehicle used to artificially carry foreign genetic material into another cell.
→ plasmid vectors small circular molecules of double stranded DNA derived from natural plasmids that occur in bacterial cells
→ characteristics:
BORDER SEQUENCES: 25 base pair (bp) imperfect repeat sequences that flank the Transfer DNA (T-DNA) region on Ti (Tumor-Inducing) or Ri (Root-Inducing) plasmids
GOI
ori - origin of replication
selectable marker - antibiotics, herbicides, metabolic agents
promoter sequences - transcription start site and RNA polymerase binding site (native, constitutive, tissue specific, inducible by chemical/environ)
→ DNA can be inserted into a plasmid if both the circular plasmid and the source of DNA have recognition sites for the same restriction endonuclease or recombinase enzyme
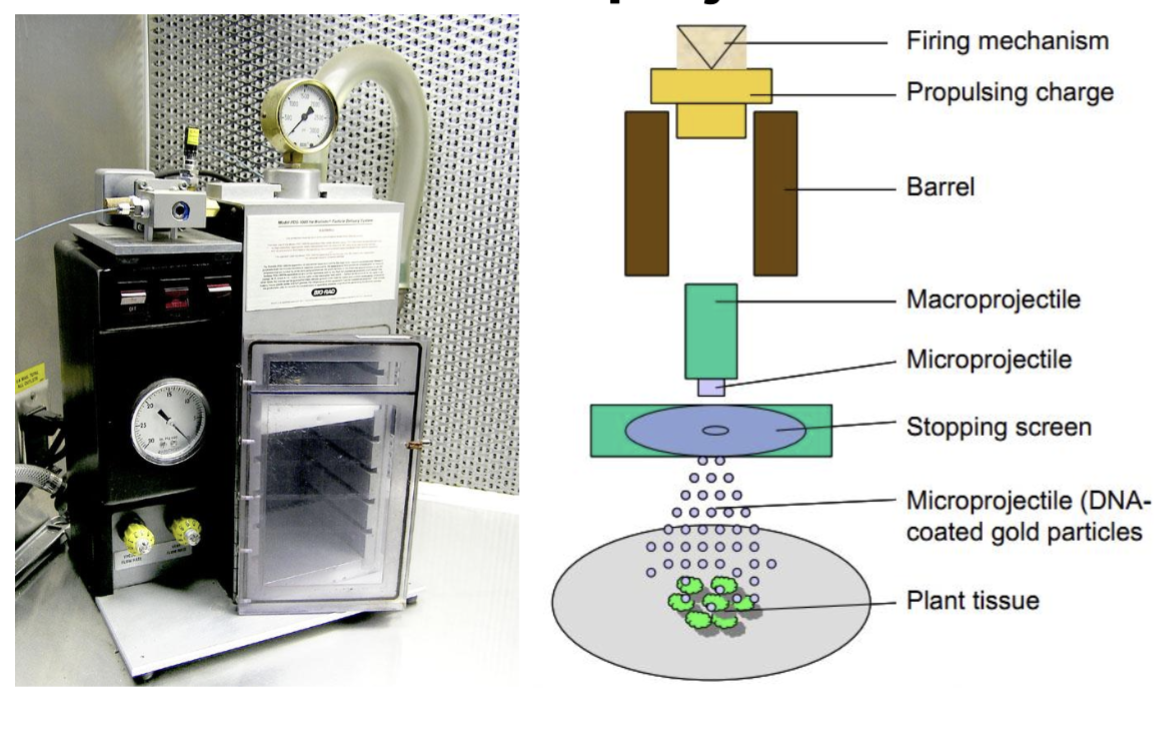
Explain Biolistic transformation.
using the Biolistic Microprojectile Gun
DNA-coated microscopic particles are accelerated into plant cells using high-pressure gas, bombarding plant cells & hoping that cell wall breaks & GOI integrates into genome
cant guarantee GOI location+duplicates may occur, need to clean up
What is genome editing?
• can add, remove or alter DNA sequences at a targeted location
• involves making cuts at specific DNA sequences with enzymes called ‘engineered nucleases’
• editing of the genome can result in changed characteristics of a cell or an organism
What is CRISPR-Cas9?
CRISPR-Cas9 (Clustered Regularly Interspaced Short Palindromic Repeats) is a bacterial immune response where following an infection, foreign DNA (spacers) are stored in the CRISPR array.
Upon infection, the array is transcribed into guide RNA that is complementary to the foreign DNA & forms a ribonucleoprotein
Cas-crRNA complex patrols the cell and scans incoming genetic material
looks for a specific matching sequence alongside a short tag called a PAM (Protospacer Adjacent Motif), which helps the cell distinguish foreign DNA from its own genome
when the guide RNA finds an exact match on the viral DNA, Cas protein acts as molecular scissors, cleaving (cutting) the viral DNA and neutralizing the threat
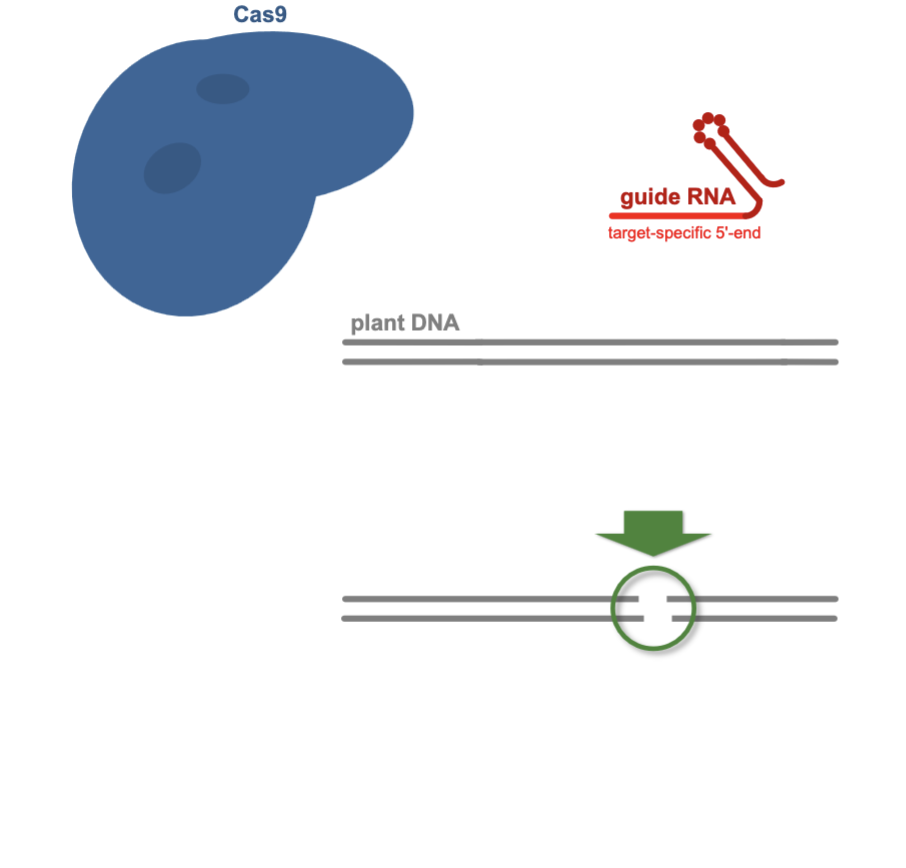
How is CRISPR-Cas9 used in genome editing? Explain the different SDN approaches.
single guide RNA is synthesised to replace the guide RNA, to direct the Cas nuclease to a specific target DNA sequence and trigger a double-strand break
a PAM sequence specific to plant to be edited must be included
Agrobacterium tumefaciens is one of the most common and effective vehicles (vectors) used to deliver CRISPR components (such as the Cas9 nuclease and guide RNAs) into plant cells via disarmed T-DNA
once in genome, CRISPR is expressed & genome edited accordingly
SDN approaches
NON GMO
SDN-1: targeted break followed by repair without a supplied template; usually small indels.
GMO
SDN-2: targeted break plus a short repair template; intended small sequence change
SDN-3: targeted insertion of a larger DNA sequence

Explain the mechanisms underlying genome editing.
Double strand breaking: Protein-DNA binding and cleaving
ZFN
TALEN
CRISPR-Cas9
Double strand repair
NHEJ (Non-Homologous End Joining)
absence of donor DNA
usu causes InDels
HDR (Homology Directed Repair)
insert/template provided
Explain why transgenic segregation can pose a problem, and solutions.
In a transgenic 2n embryo, segregation may lose the GOI.
But, in haploid duplication (n) homozygosity is achieved in 1 generation.

Explain considerations and solutions for sgRNA in crispr editing.
considerations for sgRNA
target specificity
reducing off-target editing
GC content 40-60%
Length 17-24 bp
examine potential off-target effects in genome
position + number of mismatches
transfection concentration (strength of the components used to introduce foreign genetic material (DNA, RNA, or CRISPR complexes) into plant cells)
solutions
1. Design rational/multiple sgRNA
2. Test the targeting efficiency after transient transformation
3. NGS-based screening for unintended edits
4. Engineering Cas proteins
5. Backcrossing to eliminate limited number of off-targets
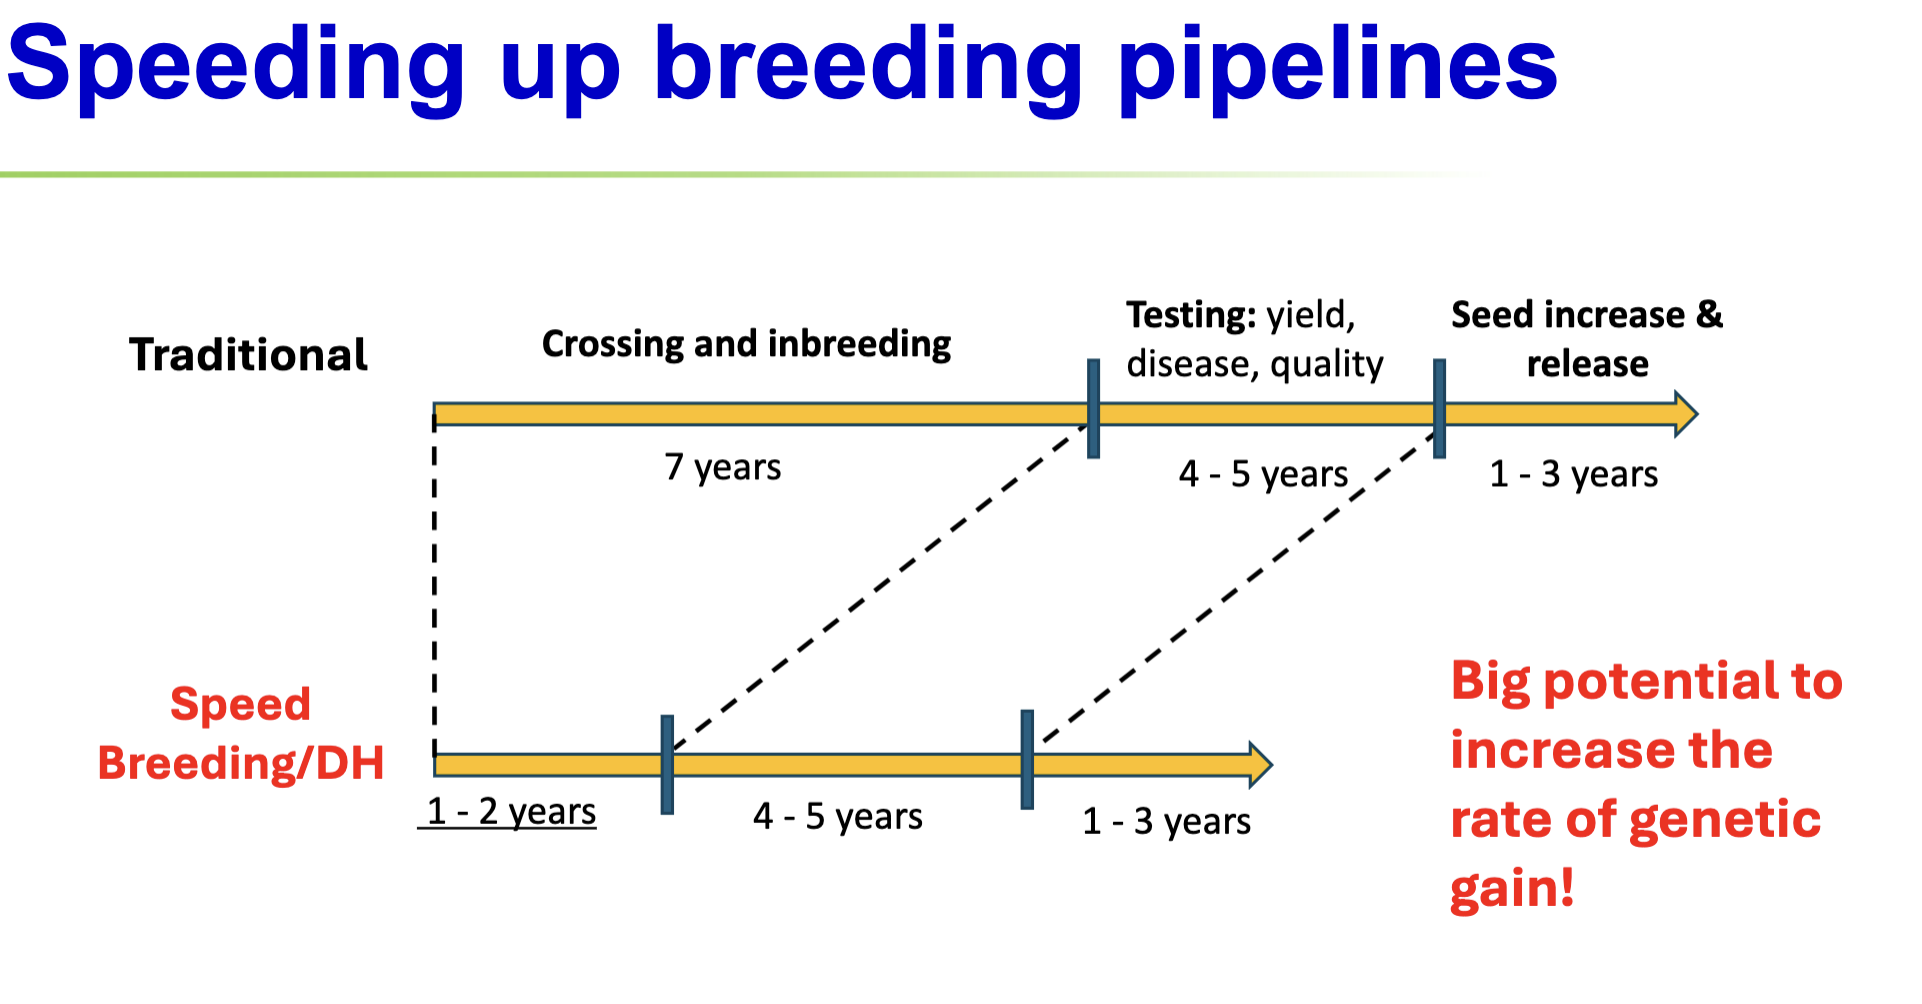
Explain modern methods that accelerate crop development in relation to the breeders equation.
i = intensity
→ select smaller number of the top performers
r = accuracy
→ use precise phenotyping
→ high throughput phenotyping (drones, sensors, AI) rapid automated processing of large amt of data without destruction to plants
sigma g = variation (without variation, selection to response is 0)
→ cross with WTs/crop wild relatives
→ de novo domestication
→ hybrid breeding
L = generation interval
→ shuttle breeding, 2 gen/yr (L x 0.5)
→ speed breeding, 6 gen/yr (L x 0.16)
→ double haploid, homozygosity in one generation
Explain how plants respond to stress.
Resist, Succumb, Avoid.

Outline basic steps in isolating a gene.
Create 1000s of a large segregating popn
Genetic mapping - map genome, find markers close to GOI (QTLs, SNPs)
Physical mapping
Candidate analysis
What is de novo domestication?
Working backwards from the norm - using genetically diverse WT/CWR that can already tolerate harsh conditions (often have desirable polygenic traits) & using biotech (often CRISPR) directly add key domesticated traits.
Explain gene stacking/pyramiding.
When trying to combine ≥2 desirable GOI into a single cultivar - cross n donors with an elite x variety (forming 1nx, 2nx, 3nx, 4nx) and backcross to a satisfying proportion of n:x, then cross the four lines, two at a time, to form an ideal hybrid in “gene stacking.”

What is linkage?
When two genes are on the same chromosome, they are said to be phyiscally linked, and cannot be independently assorted.
How can you tell if genes are linked in a test cross?
(Het x homo recessive; AaBb x aabb)
If the test of independence indicates a deviation from independent assortment, then there is linkage.
Rather than return the expected 1:1:1:1 result, the test cross returns a result where the two parental gametes (the linked genes) have a high bias.

What is coupling (cis) vs repulsion (trans) in linkage?
In coupling, the dominant alleles are linked to each other, likewise for recessive.
—> AABB x aabb → AaBb where AB and ab are linked; AB/ab.
In repulsion, the dominant and recessive alleles are linked to each other.
—> AAbb x aaBB → AaBb where Ab and aB are linked; Ab/aB.

Explain linkage drag. How can linkage drag be improved upon by geneticists, and what factors affect this?
Linkage drag is when an advantageous allele is coupled with a disadvantageous allele.
To overcome this, geneticists must seperate/’break’ the genes by increasing the chance of recombination during meiosis (gamete formation) in Prophase I, affected by species, temperature, distance between genes and chromosome length/location.
Recombination does not always happen, and is usually very low, with 1-2 events happening per chromosome in each generation. The further apart genes are, the greated chance they’ll recombine.

What are ‘hotspots’ and ‘coldspots’ in terms of recombination?
Hotspots are areas on the chromosome with a high % of recombination.
Coldspots are areas on the chromosome with a low % of recombination.
Define sister vs nonsister chromatids and chiasmata.
Sister chromatids are the identical chromosome strands that are held together by the centromere, duplicated in meiosis. Nonsister chromatids are from two different homologous chromosomes, inherited from each parent.
During recombination, chiasmata hold the non sister chromatids to exchange genetic material - often referred to as the ‘site’ of recombination.
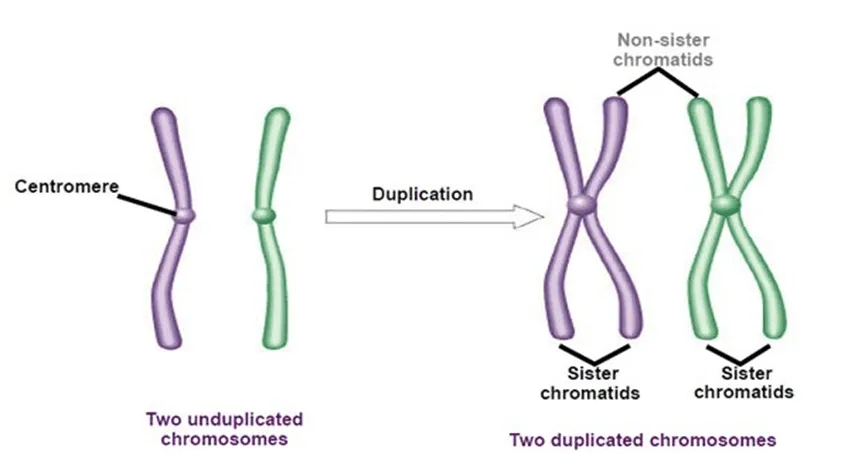
What are parental vs recombinant gametes in linkage?
Parental gametes carry the original allele combinations from an organism's parents, preserved through linkage on a single chromosome.
Recombinant gametes are created via crossing over during meiosis to break genetic linkage.
Explain the three types of linkage; with reference to the recombination factor.
r = recombination fraction = proportion (%) of recombinants in the gametes.
Complete linkage: no recombinant gametes, r = 0
No linkage: independent assortment, with equal frequency of all 4 gamete types, r = 0.5
Partial linkage: r = more parental than recombinant gametes, 0 < r < 0.5
Note that maximum r value is 0.5 (50%) - independent assortment.
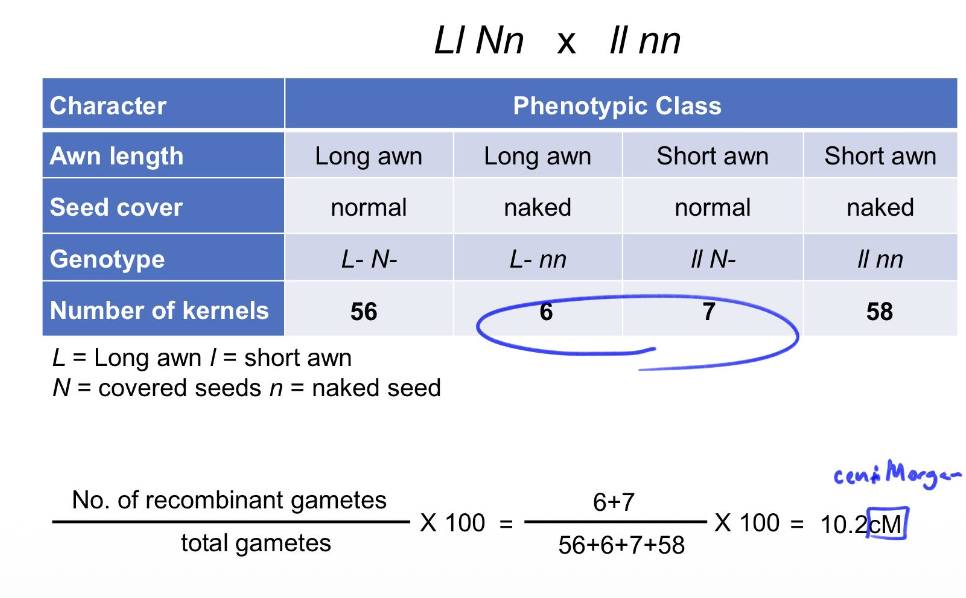
How is genetic distance of linked genes calculated? What units are used, and what do they mean?
The proportion of recombinant gametes to total gametes can be used to discover linkage distance. Chromosomal crossover is the exchange of DNA between homologous chromosomes. The probability that a crossover occurs between loci is proportional to the distance between them.
In linked genes, the recombinant genotype are detected by being very low in proportion.
No. of recombinant gametes / total games * 100 = genetic distance (cM)
Note that 1cM = 1% recombination frequency
i.e: 1 centimorgan (cM) = 1 out of 100 opportunities for recombination.
Explain physical vs cytogenetic vs genetic maps.
Physical maps = distance between nucleotides; consistent. (Mb)
Cytogenetic maps = produced after staining metaphase chromosomes with a particular dye mixture and visualizing the dark (AT-rich areas) and light-coloured bands (GC-rich areas) under microscope. Each chromosome pair stains with its own characteristic banding pattern.
Describes length, centromere position, and banding pattern after staining
Genetic map = constructed based on recombination frequency, which is not evenly distributed along the chromosomes (cM)
Based on the concept of genetic linkage: the closer two markers are to each other on a chromosome, the greater the probability that they will be inherited together.
→ At the centromere, recombination is very low, therefore markers are close together.

Explain linkage in the context fo Barley brittle rachis.
**REWATCH
What are diagnostic markers?
Things that differentiate individuals - can be morphological, biochemical, chromosomal, or DNA based(molecular) differences.
What is a molecular marker? Why is it more efficient than traditional phenotyping?
A genetic marker is a nucleotide polymorphism between individuals and has a unique location in the genome.
A molecular marker is a subset of a genetic marker - a fragment of DNA from the genome that can be used to track the inheritance of a segment of chromosome at the specific location → Segregate the same way that the alleles of genes do (Mendelian inheritence)
Offers a more specific, cheaper quicker way to identify and then select for desirable traits in a population.
Explain some limitations of traditional breeding and selection.
Population size is often massive, especially when looking for more than one trait (no. of segregants is 4^(no. of loci being bred for)
Traits can be difficult to measure/identify correctly (e.g: nutrition content)
Difficult to predict interactions with other traits or the effect of environment
Complicated for traits that are controlled by a large number of genes/polygenic, with small effect
Must screen large populations to achieve desired selective response
Sometimes plants must be grown to maturity or harvested before screening
Explain DNA-assisted breeding.
Identifies regions of genome that are linked to a trait; linking genotypes and phenotypes ← Marker assisted selection
Identifies the causal gene, and allows breeders to screen germplasms for additional variation, allele mining, diagnostic studies
Explain advantages of molecular markers.
Frequency of recombination between a trait and marker with known position tells us whether the trait is close or far apart from the marker.
Linkage of markers to the trait identify a critical region on a chromosome
Unaffected by environment or growth stage of plant (NOT a product of gene expression) ← Stable/reliable, selecting ONLY based on genes as opposed to gene + environment with phenotype !
More sensitive and specific (compared with morphological and biochemical markers) ← detects individual differences
Quick (examines lots of polymorphisms very fast)

Explain intragenic vs intergenic polymorphisms.
Intra-genic: Within coding gene
Inter-genic: Between coding genes
Difference between diagnostic and linked markers? What risk is associated with nearby markers?
Diagnostic → the actual gene responsible for the trait; takes a long time to find and verify; marker associated with trait of interest
Linked/nearby → associated with inheritance without being specific nucleotide, often nearby the diagnostic marker
→ If recombination occurs, this link can be broken and the marker will not be associated with diagnostic anymore

Name some methods of detection using DNA molecular markers.
Hybridisation
Restriction fragment length polymorphism (RFLP)
Microarray
PCR
Amplicon length polymorphism (ALP)
Simple Sequence Repeats (SSRs)
Cleaved amplified polymorphic sequence (CAPS)
Kompetitive allele specific PCR (KASP)
Amplified fragment length polymorphism (AFLP
DNA sequencing
Single nucleotide polymorphisms (SNPs)
Describe length polymorphisms.
InDel (Insertion/Deletion) - the insertion or deletion of a DNA sequence
SSRs (Simple Sequence Repeats) - when a sequence of DNA is repeated to a varied length

How are sequence polymorphisms detected as markers?
With PCR - amplifying a small section and analysing the length on a gel.
(Where the bands ARE on a gel)

How are single nucleotide polymorphisms selected for with restriction enzymes?
Restriction digestions → restriction enzymes recognise and cut at specific sequences → thus only cutting the sequence it recognises
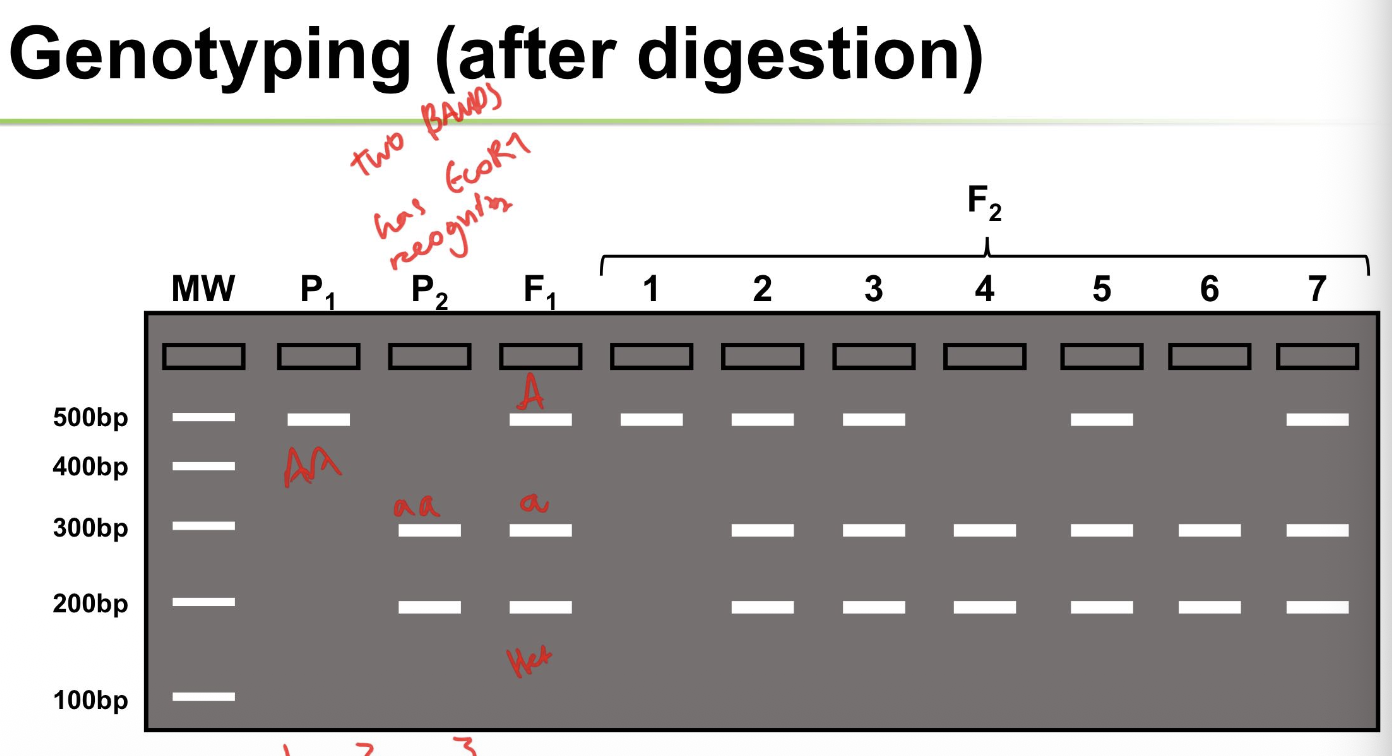
How are single nucleotide polymorphisms selected for with fluorescence?
In Kompetitive allele specific PCR (KASP), the primer for each allele is given a specific fluorescence.

Give the expected genotypic ratio for a dihybrid heterozygous cross with simple dominance/Mendelian inheritance.
RrYy x RrYy
9:3:3:1.

Explain the meaning of and ratio for complementary dominance/double recessive epistasis.
9:7.
Where two genes influence a single phenotypic trait, with two independently assorting genes (A and B) both required to produce a particular phenotype.
If either gene is homozygous recessive, the phenotype is hidden.
This leads to two phenotypes in the F₂ generation in a 9:7 ratio.
Gene Function
W = Dominant allele required for pigment production
w = Recessive allele; lacks function
B = Dominant allele required for pigment production
b = Recessive allele; lacks function

Explain the meaning of and ratio for recessive epistasis/supplementary gene action.
9:3:4.
Where two genes influence a single phenotypic trait, with one dominant gene controlling the main phenotypic effect, while the other gene, though dominant, modifies the expression of the first gene without having a visible effect on its own.
Gene Function
R = dominant allele for black coat color (hypostatic)
r = recessive allele for brown coat color (hypostatic)
Y = dominant allele allowing pigment deposition
y = recessive allele preventing pigment deposition (epistatic to B gene)
Homozygous recessive yy blocks expression of R-.

Explain the meaning of and ratio for dominant epistasis.
12:3:1.
Where two genes influence a single phenotypic trait, with dominant allele at one gene locus (W) masking the expression of alleles at another gene locus (G).
W = Dominant epistatic allele for white color
w = Recessive allele (no epistatic effect)
G = Dominant allele for yellow color
g = Recessive allele (no yellow pigment)
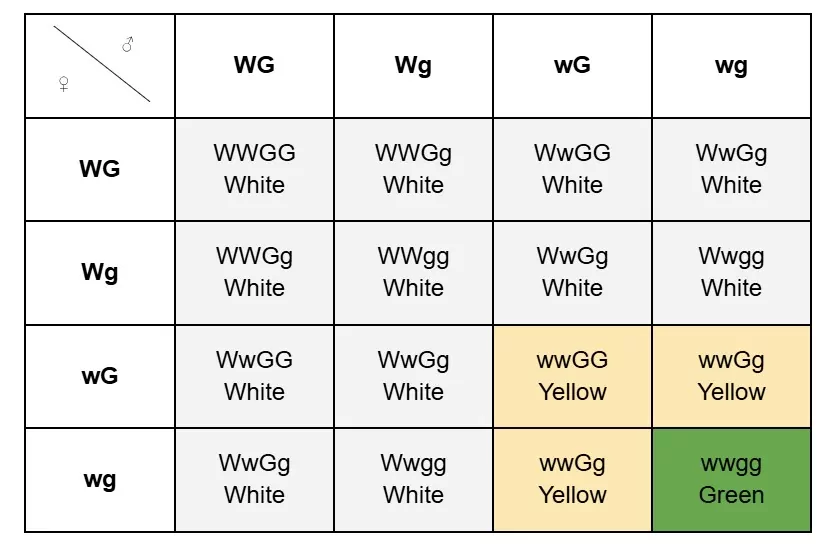
Explain the meaning of and ratio for duplicate dominant inheritance.
15:1.
Where two genes influence a single phenotypic trait, with a dominant allele at either locus (A or B) being sufficient to produce the phenotype. The absent phenotype appears only when both genes are homozygous recessive (aabb).
A = Dominant allele producing ligule
a = Recessive allele (no awn function)
B = Another dominant allele producing ligule
b = Recessive allele (no awn function)
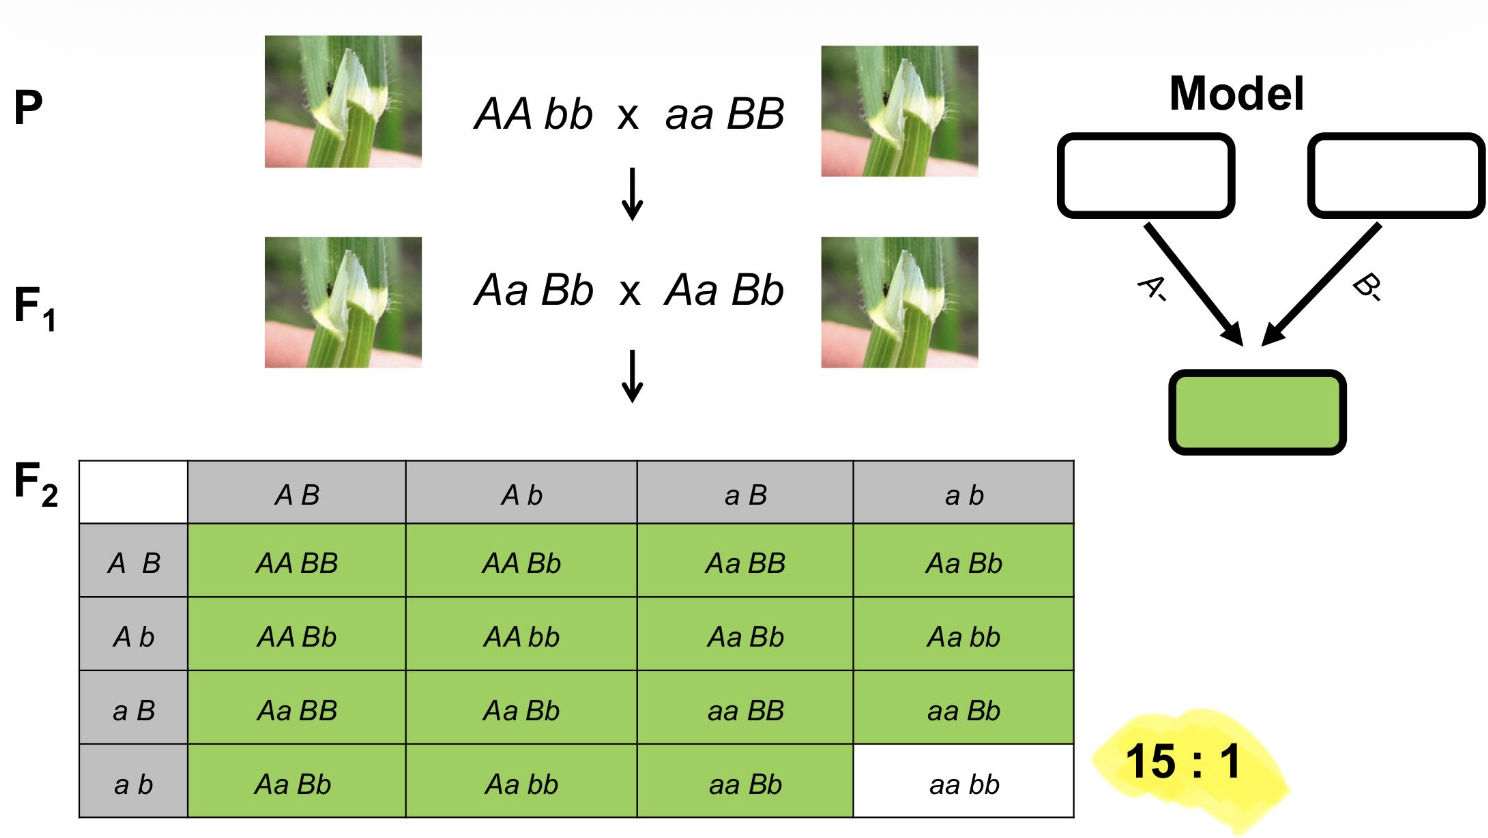
Explain the meaning of and ratio for Additive Factors (Polymeric Gene Action)
9:6:1.
Two dominant genes (A and B) independently contribute the same phenotype, but when both are present, their effects are cumulative, producing an enhanced phenotype.
E.g: Awn length.
A = Dominant allele contributing to awn length
a = Recessive allele (no effect on awn)
B = Another dominant allele contributing to awn length
b = Recessive allele (no effect on awn)

Give some examples of monogenic and polygenic traits in plants.
Monogenic traits (single genes)
Barley row-type (2row: Grow)
Barley awn length (long: short)
Pea flower color (white: purple)
Corn grain color (purple: yellow)
Corn grain type (starchy: sugary)
Disease resistance (res: susceptible)
Photoperiod response
Polygenic traits (Many genes - strongly affected by environment)
Plant Yield
Plant height
Drought tolerance
Nutrition content
Root development
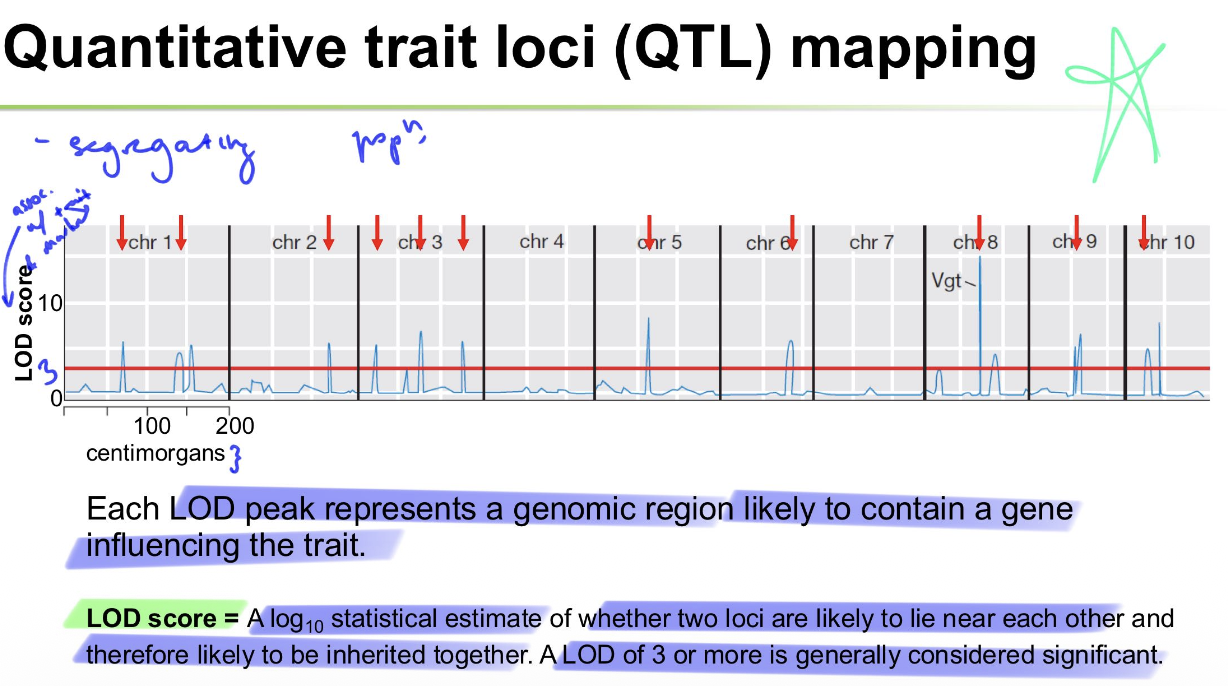
Explain QTL mapping. What scores are significant? Compare it to association mapping.
A graph depicting quantitative trait loci, measured with LOD peaks, representing a genomic region likely to contain a gene influencing the trait of interest.
LOD score = A log10 statistical estimate of whether two loci are likely to lie near each other and therefore likely to be inherited together. A LOD of 3 or more is generally considered significant.
Association mapping can assess not just two alleles like QTL mapping, but most of the common alleles in a gene pool, all at once.
Explain qualitative vs quantitative traits with example.
Qualitative traits
Inheritance simple
One or a few genes (single, two)
Distinct classes (classified, counted)
Independent of environment - discrete phenotype
e.g: Barley row-type, disease resistance
Quantitative traits
Inheritance complex
Larger number of genes contribute to expression
Continuous distribution (measured, calculated)
Expression influenced by environment
e.g: plant height, plant yield

Explain multigene/polygenic inheritance. How can you determine number of genotypes from gene pairs?
Multiple-gene hypothesis - Many genes, each individually behaving in a Mendelian way, contribute to the phenotype in a quantitative way.
With increased phenotypes controlling the variation, plus an environmental effect, one cannot classify phenotype classes, or therefore genotypes. One therefore has to measure the trait.
Consider height as an example.
Number of genotypes is equal to 2n+1 where n=number of gene pairs.
E.g: For 3 gene pairs, there are 7 genotypes as seen.

Explain the genetic model of phenotype as related to genotype and environment.
P = G + E
Where
P = phenotype
G = genotype
E = environment.
To further break it down 🤸♂:
P = A + D + I + E
Where
A = additive
D = dominance
I = epistatic
Define heritability, including broad and narrow sense, and explain the formulae.
Heritability: The proportion of variability in phenotype that is due to variation in genotype.
Key: variation and its source
VP = phenotypic variance
VG = genotypic variance
VE = environmental variance
VP = VG+ VE
VA = additive genetic variation
Broad sense: The proportion of phenotypic variation (Vp) explained by genetic variation (VG).
Broad sense heritability = H2
H2 = VG / VP
H2 = VG / VG+ VE
Narrow sense: Proportion of phenotypic variation (Vp) explained by additive genetic variation (VA).
Narrow sense heritability = h2
h2 = VA / VP
h2 = VA / (VG+ VE)
Explain response to selection (R).
Response to selection: the gain breeders get by mating selected parents.
Depends on 2 factors:
h2 (heritability)
how strongly you select (selection differential, S)
R= h2 * S
Can be seen when comparing the parent generation to the inbred top 5% of the offspring generation. If mean changes towards selected trait/distribution moves, trait has high heritability and response to selection.

What traits have domesticated plants been bred for?
Morphological, Physiological, & Genetic changes including:
1. Reduced fertility; seedless fruit
2. Loss of survival characteristics
3. Reduced or loss of toxicity or bitterness
4. Loss of protective defense structure
5. Loss of seed dormancy
6. Simultaneous maturity
7. Change in the life span
8. Change in shape of the harvested organ
9. Changing in breeding system
10. Increase in size
Define domestication & landrace species.
Domestication - the process by which plants and/or animals are genetically modified over time by humans for traits that are more advantageous or desirable for humans. Domestication is an ongoing process carried out over many generations and is a result of selection by humans; deliberate or non-deliberate.
Landrace - “A dynamic population or populations of a cultivated plant that has historic origin, distinct identity and lacks formal crop improvement, as well as often being genetically diverse, locally adapted and associated with traditional farming systems”.
What is the FLC gene?
FLOWERING LOCUS C encodes a transcriptional factor that acts as a potent repressor of flowering in plants. Upon the correct conditions (e.g: vernalisation), the repressor changes shape and allows expression the transition from vegetative to flowering.

Explain double fertilization.
1. Pollen tube: pollen grain lands on the stigma and grows a pollen tube down through the style into the ovule - nucleus divides into two haploid sperm cells .
2. Syngamy: one sperm cell fuses with the haploid egg cell to form a diploid 2n zygote, which eventually develops into the plant embryo
3. Triple Fusion): second sperm cell fuses with the two haploid polar nuclei in the central cell to form a triploid 3n primary endosperm nucleus
4. Endosperm Formation: triploid cell divides to form the endosperm, a nutrient-rich tissue (containing starches, sugars, fats, and proteins) that feeds the growing embryo

How do plants tell night from day?
Photoperiods are determined by morphological change of phytochromes & circadian genes.
Phytochromes: Detect red and far-red light. When sunlight hits them at dawn, they shift into an active form (Pfr) to signal that day has arrived.
Circadian genes: interlocking genes that switch each other on and off to induce morphological changes, synchronised to phytochromes.