Statistics Flashcards
 Call Kai
 Learn
 Practice Test
 Spaced Repetition
 Match
 Flashcards
 Knowt Play
1/32

Earn XP
Description and Tags
* left off at lecture 8
33 Terms
Variables
Any characteristics, number, or quantity that can be measured or counted and whose value changes (varies) across different data units or over time… vary from one another
If a characteristic never changes across your study group, it is a constant rather than this.
Levels of variables
Number of variables
Ex: Education level (High School, Bachelor’s, Master’s, Ph.D.) = 4 levels of variables
Constants
A characteristic, value, or number that doesn’t change across all observations, subjects, or units in a given data set or study… Don’t vary from observation to observation.
Qualitative
Non-numerical, descriptive information. Values are categories.
Ex: Hair colors, easy/medium/hard, male vs. female
Quantitative
Collection, organization, analysis, and interpretation of numerical data. Meaningful #’s.
Ex: mean, median, standard deviation, t-tests, ANOVA, height, weight, temperature, # of students in a class, stock prices.
IV (Independent variable)
(X) Variable that is changed. What is manipulated or controlled to see if it causes a change in another variable.
Ex: Hours spent studying
DV (Dependent Variable)
(Y) The outcome or thing you measure to see if it responds to the IV.
Ex: Exam score
Quasi-Experimental Desgin
Researcher groups people based on pre-existing/current conditions. Participants are not randomly assigned to treatment and control groups.
Experimental Design
Random grouping. Research holds active control over who receives the intervention and when. We need basic group comparisons (t-tests, ANOVA) to test any differences.
Determining Association vs Causation from Study Design
-Association: Observational studies. Measures patterns, correlations, odds ratios between variables. Do not prove causation b/c they suffer from confounding (unmeasured or third variables affecting both factors), and reverse causation (not knowing whether A caused B or B caused A)
Ex: Finding that people who eat more chocolate have lower heart rates is an association; hidden factors like overall diet or exercise may be driving both.
-Causation: Experimental/Quasi-Experimental studies. They measure direct effect of an independent variable on a dependent variable by actively manipulating the exposure. They can support causation b/c randomization breaks the link between confounding variables and the exposure, while control groups and temporal ordering ensure the cause precedes the effect.
Potential Confounds
An unmeasured or extraneous factor that relates to both the independent and dependent variable, creating a false cause-and-effect relationship.
Ex: Increase in ice cream consumption and increases shark attacks…. whenever there’s the hidden third factor of temperature.
Hypothesis
A proposed explanation made on the basis of limited evidence as a starting point for further investigation.
Non-directional Hypothesis
Does not specify a direction with regard to differences (or relations) between parameters → result in two-tailed tests.
Directional Hypothesis
Specifies a direction with regard to differences (or relations) between parameters → result in one-tailed tests.
Research Hypothesis
Statement of what the researcher expects to find from the study.
Alternative Hypothesis
Stats hypothesis that is the alternative to the null positioning that a difference (or relation) exists between population values.
Null Hypothesis
Statistical hypothesis of no difference (or no relation) or no difference of interest between population values.
Measures of Central
Mean, median, mode
Measures of Dispersion
Range, variance, standard deviation
Normal/bell curve

Bimodal

Right skewed/positive skew
Ex: income

Left skewed/negative skew
Ex: easy tests

How do you find ∑XY?
X value times Y value
How do you find ∑X∑Y?
Sum of all X values times sum of all Y values
How do you find ∑X2? (Or ∑Y2)
(X value)2 + (X value)2 + ….
How do you find (∑X)2? (Or (∑Y)2)
(Sum of all X values)2
Ex: (272)2 = 73984…. (∑X)2
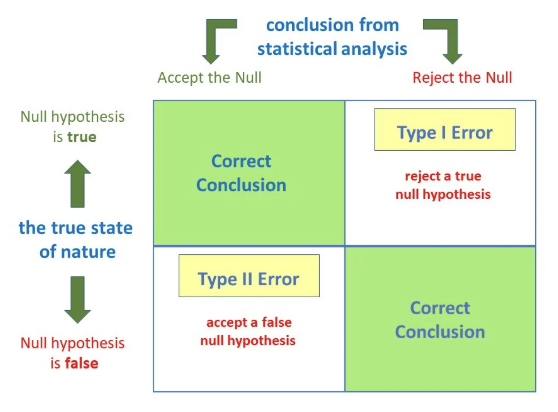
Type I Error
when you reject a true null hypothesis (reject the true null)

Type II Error
When you fail to reject a false null hypothesis (accept the false null)
Directional Hypothesis
Predicts the specific direction of the relationship between variables (one-tailed)… increase or decrease.
Increase or decrease is due to the IV affecting the DV.
Ex: Students who study for more hours will score higher on the exam.

Non-directional hypothesis
Predicts that there is a relationship between variables, but doesn’t specify the direction. The IV will be related to the DV. Doesn’t say the direction, but there is a relationship.

Population vs parameter
A population (the group) is the entire group of individuals, items, or events being studied, while a parameter (the number) is a numerical value or summary measure (such as a mean or proportion) that describes a characteristic of that entire population
Sample vs statistic
A sample is a smaller, manageable subset of individuals or items chosen from a larger group (ex: sample of 100 voters), while a statistic is a numerical value (such as an average or percentage) calculated from that sample data