Household Choices
 Call Kai
 Learn
Learn Practice Test
 Spaced Repetition
 Match
Match Flashcards
 Knowt Play
1/16

Earn XP
Description and Tags
Name | Mastery | Learn | Test | Matching | Spaced | Call with Kai | Chat |
|---|
No analytics yet
Send a link to your students to track their progress
17 Terms
What is the budget constraint (budget line)?
It describes the limits to the household’s consumption choices when constrained by income, and the price of goods and services available
What is the budget equation?
Where Expenditure = Income
e.g. PC*QC + PF*QF ≤ Y
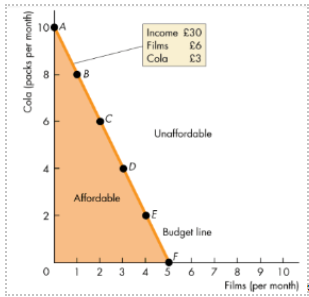
Explain the budget constraint graph
On the line, she exhausts all of her income
To the left shows affordable consumption bundles
TO the right shows unaffordable consumption bundles
The slope of the graph = - (Relative price of films to colas)
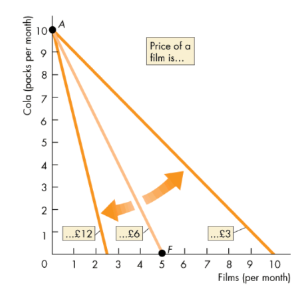
What happens to the budget constraint when a change in price occurs?
e.g. if price of cola stays constant, but price of film changes:
If price of film increases, the relative price of films to colas increases, so the slope becomes steeper with a price increase as a lower number of consumption bundles are considered affordable and vice versa
What happens to the budget constraint when a change in income occurs?
It results in a parallel shift of the budget line. If income decreases, there is a parallel shift towards the origin, as there are now fewer affordable consumption bundles to choose from
What are preferences?
They summarise what a consumer wants, and allows them to rank any 2 bundles of goods according to their desirability
As a consumer has more of one good, their willingness to substitute it for another good decreases
What 4 main properties to preferences have that enable us to study the allocation program
Completeness - Consumer is able to state a preference between any pairs of consumption bundles
Transitivity - Assumes consumers are consistent with their choices
Non-satiation (More is better) - Other things equal, we prefer more of a good over less, provided we can store or dispose of the goods
Convexity - Consumers prefer mixed bundles over extreme bundles
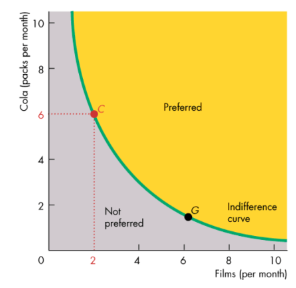
What is an indifference curve?
It shows all the bundles of goods that give the consumer equal utility/consumer is indifferent
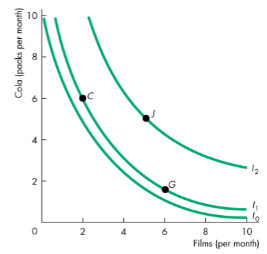
What are preference maps?
They are a series of indifference curves, where consumption bundles on higher indifference curves are always preferred, as you can get more goods and services
What is the marginal rate of substitution?
It’s the slope of an indifference curve, and measures the rate at which a consumer is willing to give up a unit of y, in order to gain an additional unit of x
MRS = -∆y/∆x
What is a diminishing rate of substitution?
It’s a general tendency to give up less of a good y, and at the same time remain indifferent, as the quantity of good x increases
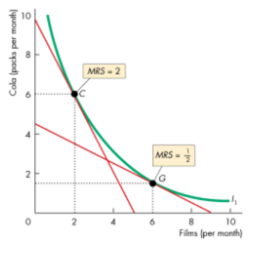
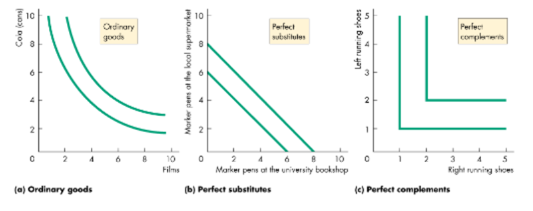
What is the degree of substitutability, and how does it depend on what type of good it is? How is the best affordable choice found?
It’s the degree to which one good can be replaced by another and remain indifferent, and depends on whether it’s an ordinary good, a perfect substitute or a perfect complement
For ordinary goods, MRS is not constant
For perfect substitutes, MRS is constant at -1
For perfect complements, MRS = 0, infinity, or undefined
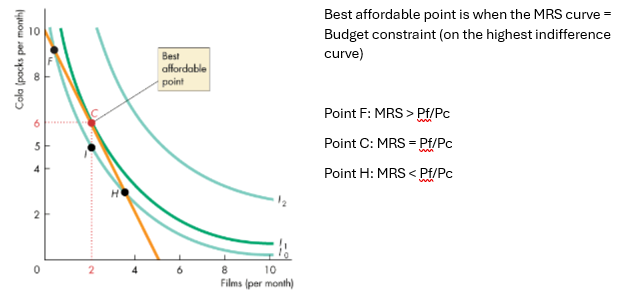
Where is a consumer’s best affordable point?
On the budget line
On the highest attainable indifference curve
Has a MRS between the 2 goods equal to the relative price of the 2 goods
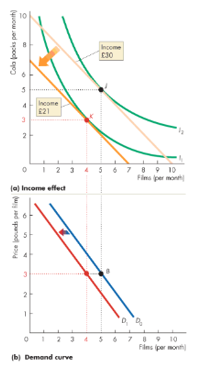
How do you predict a change in income?
You reverse the hypothetical income cut and restore it to it’s original level. As we’re on indifference curve I2 her best affordable point is J. SO the move from K to J is the income effect
How do you predict a change in price?
For a normal good, a fall in price always increases the quantity consumed
This is proved by dividing the price effect into the:
Substitution effect (moves the consumer along a given indifference curve to a new MRS)
Income effect (moves the consumer to a higher or lower indifference curve)
e.g. when price of films decreases, I can buy more films as they are cheaper (income effect). I can also buy more films because the relative price of films to cola has fallen (substitution effect)
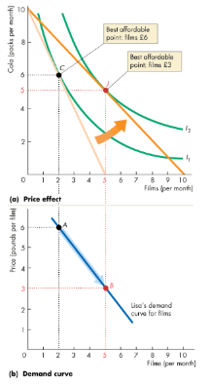
How does the income and substitution effect give one reason as to why the demand curve slopes downward?
For normal goods, as income increases, no. of films increases, so the income effect is positive. For normal goods, income effect reinforces the substitution effect, so demands curve slopes downward
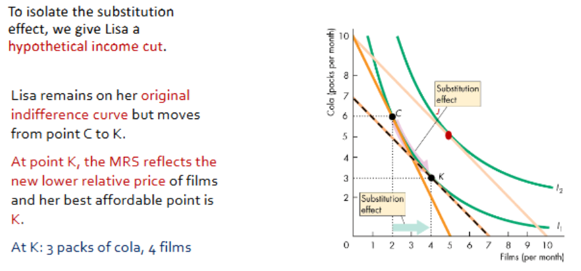
How does an inferior good make the demand curve slope upwards?
For inferior goods, when income increases, the quantity bought decreases. Therefore, the income effect works against the substitution effect. As long as substitution effect dominates, demand curve will still be -ve, but if income effect dominates, it will slope upwards.
However, this is only a hypothetical scenario and doesn’t occur in real life