SCI 201 Midterm Questions
 Call Kai
 Learn
 Practice Test
 Spaced Repetition
 Match
 Flashcards
 Knowt Play
1/17

There's no tags or description
Looks like no tags are added yet.
18 Terms
What is stratified random sampling?
- In stratified random sampling, the target population is divided into strata, based on a pilot study or some prior information.
- Items within each stratum or subpopulation are considered to be relatively homogeneous.
- Proportional allocation = sampling intensity in each stratum is proportional to the estimated density of the items in the stratum or size of the stratum.
- Within each stratum, simple random sampling (SRS) is performed.
When writing a literature review, there are three main ways to avoid plagiarism.
Briefly describe just two of these ways.
- Quoting what someone else wrote, word for word, and citing the reference (this is common in social sciences, but not natural sciences).
- Paraphrasing what someone else wrote, that is, writing it in your own words, or using statistics or graphs from someone else’s work and then citing the reference.
- Summarizing what someone else wrote (writing it in your own words in a more concise manner) or integrating what several people discovered, and citing the reference(s).
Explain the difference between ratio scale data and interval scale data. Give an example of each.
- Ratio scale has a true zero point, which makes it possible to establish a ratio, e.g., the Kelvin scale is a ratio scale for measuring temperature: absolute 0°K is -273°C, so comparing 313°K (40°C) to 293°K (20°C), the ratio is 313/293 = 1.068. This is a real ratio.
- Interval scale has no true zero point, making it impossible to establish a ratio, e.g. Temperature on the Celsius scale, 0 has no real meaning; it is arbitrary, so 40°C is not twice as hot as 20°C.
Compare and contrast meta-analysis and review studies; that is, briefly point out the similarities and differences between these two types of studies
Meta-analysis and review studies are similar in that they both consist of secondary research since they do not obtain original data. Both meta-analysis and review studies make use of information obtained from many sources or studies based on primary research. In addition, review studies may also obtain information from other secondary research, such as books and other review studies; whereas, this is not usually the case for meta-analysis. Both meta-analysis and review studies lead to overviews that are very comprehensive in comparison with the individual studies upon which they are based.
However, a basic difference is that meta-analysis synthesized the findings of several other studies that deal with a similar topic and, in the process, re-analyzed the combined data. This is not the case for review studies which do not re-analyze any data, but simply syntheses information from other documents in which data analysis and conclusions have already been completed. Review studies, therefore, can usually synthesize information from more sources than meta-analysis. At the same time, however, review studies often come up with original theories, concepts and trends that may not have been put forward in any of the source studies.
Give just four potential errors that should be avoided when writing questions for a questionnaire or interview schedule. Give a brief example of each error to support your answer.
- Avoid emotional language, just use neutral language. For example, asking, “Do you think that is obnoxious behaviour?”, instead of asking “Do you think that is proper or improper behaviour?”
- Avoid ambiguity. For example, if you ask, “What is your income?”, does this mean weekly, monthly, before taxes or after taxes, just salary income or all sources?
- Avoid double-barreled questions, that is, two or more questions joined together, because the respondent may want to answer differently for each question. For example, “Does your employer provide pension and health insurance benefits?”
- Avoid negative questions because, in normal conversation, a negative question prompts an expected, usually positive response and creates bias. For example, when you say “Don’t you love that movie?”, it actually prompts a positive answer, “Yes, I love it.”
There are many reasons for conducting a pilot study before you embark on the main study. Mention just four advantages or benefits you would gain from conducting a pilot study.
1. In the case of a social survey, conducting a pilot study enables the researcher to test the questionnaire or interview schedule to see if it is properly designed, that is, whether the questions make sense, are unambiguous and that there are no leading questions.
2. Conducting a pilot study can help to check whether the planned sample size is too small, too large, or is just adequate.
3. A pilot study gives the researcher practice in recording data in order to be able to do it accurately and, if necessary, quickly, in the case of study units that move quickly or it is difficult to detect the variables being studied.
4. A pilot study helps a researcher to adjust the levels of the treatments such that they are more likely to show significant differences.

a) Is this basic or applied research? Very briefly explain your answer.
b) Is this an observational or experimental study? Very briefly explain your answer.
c) Name the type of research design. Also, identify the variables/factors in this study and state what type each is with respect to its role in the research (e.g., explanatory or response) as well as the type of scale used (e.g., categorical, ordinal, etc.). Also, state the levels of each factor/variable, where applicable.
d) What could be the advantage of timing each worker to operate one of each type of machine, as opposed to having different workers operate each type of machine?
e) Based on this study, will it be possible to make either population inferences or causal inferences or both? Briefly explain your answer.
a) This is applied research since it will benefit the company by increasing their production efficiency and the customers may benefit from lower prices
b) This is an experimental study since there is an explanatory variable that is manipulated, that is, testing machine Model A versus Model B. Moreover, the workers are randomly assigned to machines of each type and they are assigned in a random order.
c) This is a paired design with one categorical explanatory factor/variable that has two levels or categories (Model A and Model B). There is one continuous, quantitative response variable, that is, the time taken to assemble one unit of the product.
d) Since workers themselves work at different speeds, having each worker operate each type of machine and analyzing the differences in the speed of operation will help to eliminate the effect of the workers’ speeds on the analysis.
e) It is possible to make population inferences since 8 workers were randomly sampled from the workers in the company (the target population). It will also be possible to make causal inferences since the workers were randomly assigned to the two types of machines in a random order.

The numbered statements below have been selected from, and adapted after, Bromley and Hood (2013). However, these statements have been randomly shuffled and appear in an incorrect order. Under just two headings, Introduction and Methods (no subheadings), rearrange these statements in a logical order that would be suitable for a good (though incomplete) research proposal. Simply write the numbers of the statements beneath the appropriate headings.
Introduction: 6, 4, 8, 1
Methods: 5, 3, 7, 2
In 2023, the municipal office in a city called Andrada conducted a study on energy consumption in order to help manage the availability of their energy resources. They divided their city into four districts (Northwest, Southwest, Northeast, and Southeast). Within each district, they randomly sampled 40 houses, and for each house, they recorded house area (in m2) and energy consumption (in kWh). It took 5 months to collect the data, analyze it, and write the report.
a) Is this basic or applied research? Very briefly explain your answer.
b) Identify the study units.
c) What is the population of interest?
d) State the following:
What is/are the explanatory variable(s) or factor(s)? State the type of data scale used (e.g., categorical, ordinal, continuous quantitative, etc.) for recording each explanatory variable.
What is/are the response variable(s)? State the type of data scale used (e.g., categorical, ordinal, continuous quantitative, etc.) for recording each response variable.
e) Give details of where the study was conducted.
f) Give details of the temporal aspects of the study.
g) Is this an observational or experimental study? Very briefly explain your answer.
h) Based on this study, will it be possible to make population inferences? Explain your answer.
i) Based on this study, will it be possible to make causal inferences? Explain your answer.
a) This is applied research since the reason for conducting the research was to better manage the energy resources in the city.
b) The study units are the 40 houses in each district of the city on which the data were recorded.
c) The population of interest is all the houses throughout the entire city.
d) There are two explanatory variables, which are the districts of the city (a categorical variable) and the sizes of the houses (continuous, quantitative variable).
There is one response variable, which is energy consumption (a continuous, quantitative variable).
e) The study was conducted in Andrada in four districts (Northwest, Southwest, Northeast, and Southeast).
f) The study was conducted in 2023. It took 5 months to collect the data, analyze it and write a report.
g) This is an observational study since the researchers did not manipulate the explanatory variables, there was no attempt to control extraneous variables, and there was no random assignment of the study units to any groups.
h) It is possible to make population inferences regarding energy consumption since the houses were randomly selected from the districts.
i) Causal inferences can not be made because there was no random assignment of study units to different groups since this was an observational study, not an experiment.
The numbered statements below have been selected from, and adapted after, a research proposal written by Pendo Matulanya for her independent research project conducted in 2009. However, these statements have been shuffled and appear in an incorrect order. Under the following headings and subheadings, rearrange these statements in a logical order that would be suitable for a good (though incomplete) research proposal. You do NOT need to type out the statements again, simply write the numbers of the statements beneath the appropriate subheadings in a logical order. [Note: No subsection for a literature review has been included to reduce the length.]
INTRODUCTION
Statement of the Research Problem
Hypotheses
Significance of the Study
MATERIALS AND METHODS
Research Design
Techniques for Data Collection
Data Analysis
1. This study will provide information on the present status of the coral reef ecosystem at Pangavini, which will facilitate planning for conservation and management of the important marine resources found there.
2. After laying down the tape, a period of 10 minutes will be given to allow fish to return to the area. Then, three swimming transect will be conducted along each belt transect with 10-minute intervals between.
3. However, no studies have been conducted at Pangavini to assess possible coral recovery following the major coral bleaching event of 1998, which caused widespread death of corals worldwide. Also, no studies have been carried out at Pangavini to determine the abundance of fish associated with the Montipora stands.
4. This study has the following hypotheses:
The percent cover of Montipora and other hard corals is likely lower at present than it was before the 1998 coral bleaching event.
Due to the sheltered location of Pangavini Island, the percent hard coral cover is predicted to be significantly greater on the exposed side than on the sheltered side.
Reef fish abundance is expected to be significantly greater on the exposed side of Pangavini than on the sheltered side.
5. Panagvini is the smallest island in the Dar es Salaam Marine Reserve System and it is relatively sheltered from water movement and wave action due to its location between the two larger islands and the mainland.
6. The two-sample t-test for independent samples will be used to compare both hard coral cover and fish abundance on the exposed and sheltered sides of Pangavini.
7. A previous study conducted by Kamukuru (1997) at Pangavini Island showed that the average percent hard coral cover was 75%, with Montipora being the dominant coral genus.
8. Therefore, the purpose of this study is to assess and compare the percent cover of Montipora and other hard corals, as well as the abundance of associated reef fish, on the exposed and sheltered sides of Pangavini.
9. For each swimming transect, the coral reef fish visual census technique (English et al. 1997) will be applied to estimate the abundance of reef fish. Subsequently, the benthic lifeform transect technique (English et al. 1997) will be used to perform a rapid assessment of the percentage cover of hard coral and other benthic categories within each belt transect.
10. The Dar es Salaam Marine Reserve System includes the islands of Pangavini, Mbudya and Bongoyo, which are surrounded by fringing coral reef ecosystems that contain a wide variety of hard corals and associated reef organisms (Hamilton and Brakel, 1984; Kamukuru, 1997; Ngowo, 1999; Semesi, 2000; Wagner et al., 2001).
11. Eight belt transects (each 5 m x 10 m) will be established on the exposed side of Pangavini and six belt transects on the sheltered side of the island. To demarcate each transect, two underwater tapes will be laid on the substratum 5 m apart parallel to each other for a length of 10 m.
INTRODUCTION
Statement of the Research Problem – 10, 5, 7, 3, 8
Hypotheses – 4
Significance of the Study – 1
MATERIALS AND METHODS
Research Design – 11, 2
Techniques for Data Collection – 9
Data Analysis – 6
What is Simple Random Sampling?
Every individual is selected completely randomly and independently
Every group or area of the population has an equal chance of selection
What is Systematic Random Sampling?
The first study unit or individual is selected randomly, and then all other individuals are selected sequentially using some fixed increment (every 30 seconds of swimming over a coral reef, every 10m, every 5 minutes, every 5th person, etc.)
What are Ordinal Scale Variables/Data?
Data or observations which can be put in order from lowest to highest, but do not have a constant interval between successive units (data can be ranked)
Not truly numerical, so some types of hypothesis tests cannot be applied.
What are Quantitative Variables/Data?
A numerically valued variable
Constant interval size between successive units
Discrete/Discontinuous Variables are variables whose values can only take on specific values (whole numbers)
Continuous Quantitative Variables are variables whose values can take on an infinite number of possible values between any observed range

What are the descriptions of variables, design, purpose, and forward planning for data analysis?
Single factor (one categorical variable), which is seed type, with 4 categories
The purpose is to test for a difference between observed frequencies and expected frequencies based on a theoretical ratio
Analysis: Chi-Square Goodness of Fit Test (nonparametric test)
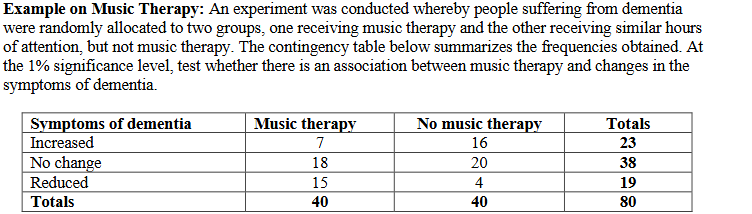
What are the descriptions of variables, design, purpose, and forward planning for data analysis?
Two Factors (two categorical variables), music therapy vs. no music therapy, and changes in symptoms of dementia in 3 categories
The purpose is to test for an association between the two variables
Analysis: Chi-Square Test for association (nonparametric test)

What are the descriptions of variables, design, purpose, and forward planning for data analysis?
One-proportion Z-Test
Based on the frequency of one categorical variable converted to a decimal, becoming a proportion
The purpose is to test for a difference between one population proportion (based on the sample proportion of those who used drugs in 2007) and a hypothesized proportion (13.6% of Americans who used these drugs in 2000).

What are the descriptions of variables, design, purpose, and forward planning for data analysis?
Two Proportions Z-Test
Based on the frequencies of two categorical variables that are converted to proportions
The purpose is to test for a difference between two population proportions based on two sample proportions (one-tailed: testing whether the first proportion is greater than the second proportion)