hs375 unit 1
 Call Kai
 Learn
Learn Practice Test
 Spaced Repetition
 Match
Match Flashcards
 Knowt Play
1/86

There's no tags or description
Looks like no tags are added yet.
Name | Mastery | Learn | Test | Matching | Spaced | Call with Kai | Chat |
|---|
No analytics yet
Send a link to your students to track their progress
87 Terms
5 L/min
average cardiac output
0mmHg
pressure of venous circulation
20-30 mmHg
pressure in right ventricle
10 mmHg
pressure in lungs and pulmonary veins
100-140 mmHg
pressure in systemic circulation
GI tract → liver
organs that have circulation in series besides the heart
atrial natriuretic peptide and antidiuretic hormone
hormones synthesized/stimulated by heart
inotropy
forcefulness of contraction
Ach binds to M2 receptor or adenosine binds to A1 receptor→ inhibits adenylyl cyclase → decreases cAMP concentration → reduces inotropy
regulation of contraction via L-type channels
norepinephrine binds to alpha receptor → PL-C forms IP3 from PiP2 → stimulation of Ca release from SR → increased inotropy
regulation of contraction via SR calcium release
higher intracellular Ca or more stretch → increased inotropy, more acidic conditions → reduced inotropy
regulation of contraction via calcium binding to TN-C
increased cAMP → increased phosphorylation of myosin heads → increased inotropy
regulation of contraction via myosin ATPase
PK-A phosphorylates phospholamban → removes inhibitory effect on SERCA pump → more Ca pumped into SR → increased Ca release → increased inotropy
indirect regulation of contraction via calcium reuptake
inhibition of Na-Ca antiporter or active Ca pump → increased intracellular Ca → increased inotropy
regulation of contraction via calcium efflux
digoxin
intentionally reduces Calcium efflux to increase inotropy; inhibits Na-K pump → Na-Ca antiporter reverses → higher intracellular calcium
hypoxia
pathologic reduction of calcium efflux that decreases inotropy; lack of O2 → ATP deficiency → no Na-K pump activity → reversal of Na-Ca antiporter → increased intracellular calcium paired with ATP deficiency
lucitropy
relaxation; shares mechanisms with inotropy. rate of relaxation = how quickly intracellular calcium is reduced
calveolae
divots in vascular smooth muscle cells that enhance neurotransmitter response
vasoconstriction
decrease in lumen radius due to circumferential shortening of sarcomeres in smooth muscle
vasodilation
increase in lumen radius due to circumferential relaxation of sarcomeres in smooth muscle
intima
single endothelial cell-thick layer that facilitates blood flow through the lumen
media
middle layer of vessel containing smooth muscle and elastin
adventitia
outer layer of vessel containing collagen and nerves
vascular MLCK
phosphorylates myosin heads leading to vasoconstriction
vascular MLCP
dephosphorylates myosin heads leading to vasodilation
epinephrine, adenosine, and PGI2
agonists for Gs protein pathway (beta 2 receptor)
norepinephrine
agonist for Gi protein pathway (alpha 2)
norepinephrine, endothelin, angiotensin, vasopressin, acetylcholine (theory)
agonists for Gq protein pathways (alpha 1)
Gs protein increases cAMP → cAMP inhibits MLCK → myosin head not phosphorylated → vasodilation
Gs (beta 2) protein pathway
Gi inhibits cAMP → MLCK not inhibited → myosin heads phosphorylated → vasoconstriction
Gi (alpha 2) protein pathway
Gq activates IP3 → IP3 activates release of Ca from SR → Ca binds to calmodulin → Ca-calmodulin complex activates MLCK → myosin heads phosphorylated → vasoconstriction
Gq (alpha 1) IP3 protein pathway
Gq protein activates rho-kinase → rho-kinase inhibits MLCP → myosin heads not dephosphorylated → vasoconstriction
Gq (alpha 1) rho-kinase pathway
increased extracellular K+
results in depolarization and more opening of ion channels for contraction
NO
activates cGMP → activates MLCP → vasodilation; inhibits leukocyte activity
myogenic response
reflexive contraction following activation of ion channels from increased blood flow
-90 mV
resting membrane potential of a cardiac myocyte
depolarization phase of cardiac myocyte
m gates open, h gates close slowly
resting potential phase of cardiac myocyte
m gates is closed and h gate is open
repolarization phase of cardiac myocyte
m gates close and h gates open again
partial depolarization
results in activation of fast sodium channels due to closing of h gates; can be caused by hypoxia or hyperkalemic solution; heart does not beat
resting membrane potential is maintained by the Na-K pump in this phase
phase 4 of cardiac myocytes
depolarization due to influx of sodium
phase 0 of cardiac myocytes
initial repolarization due to potassium efflux and inactive sodium channels
phase 1 of cardiac myocytes
voltage gated calcium channels open, leading to calcium plateau and sustained contraction
phase 2 of cardiac myocytes
voltage gated calcium channels close and potassium efflux increases
phase 3 of cardiac myocytes
absolute refractory period
occurs when h gates are closed after phase 3 so no AP can be produced
relative refractory period
when myocytes are technically capable of AP given a suprathreshold stimuli, such as exercise
spontaneous depolarization due to slow T-type calcium and sodium leak channels
phase 4 of pacemaker cells
slow inward influx of calcium through L-type channels
phase 0 of pacemaker cells
repolarization due to increase in potassium efflux
phase 3 of pacemaker cells
calcium channel blockers
block L-type calcium channels to slow conduction rate and dilate vessels, leading to cardiac myocyte to look like pacemaker curve
vagal tone
when vagus nerve acts on heart rate to keep it below 100 bpm
chronotropy
adjustment in heart rate, negative or positive
norepinephrine increases heart rate, acetylcholine decreases heart rate
autonomic control of pacemaker activity
increase in thyroid hormone
positive chronotrope
increase in potassium or hypoxia
negative chronotropes
beta blockers
block beta-1 receptors to decrease heart rate and contractility
abnormal automaticity
spontaneous AP generation when fast sodium channels are blocked
early afterdepolarizations
AP generated during phase 3, current carried by calcium leak channel
delayed afterdepolarizations
AP generated during phase 3 or 4 as a result of ischemia, digoxin toxicity, or increased catecholamines
AV node
slowest point of electrical conduction
ectopic beat
beat originating outside of SA node
local re-entry
AP meets non-excitable tissues and keeps looping to stimulate cells off-cycle
global re-entry
AP bypasses AV pause before entering ventricles and keeps looping to cause inefficient beats
P wave
represents atrial depolarization
QRS complex
represents ventricular depolarization
T wave
represents ventricular repolarization
PR interval
time from onset of atrial depolarization to onset of ventricular depolarization
ST segment
period when ventricle is depolarized, corresponding to plateau of ventricular AP
QT interval
duration of ventricular APs
0.08-0.1 sec
duration of P wave
0.06-0.1 sec
duration of QRS complex
0.12-0.2 sec
duration of PR interval
0.2-0.4 sec
duration of QT interval
sinus rhythm
indicated when P:QRS is 1:1
2.0mm upwards or 0.5mm downwards
normal ST segment variation
atrial flutter
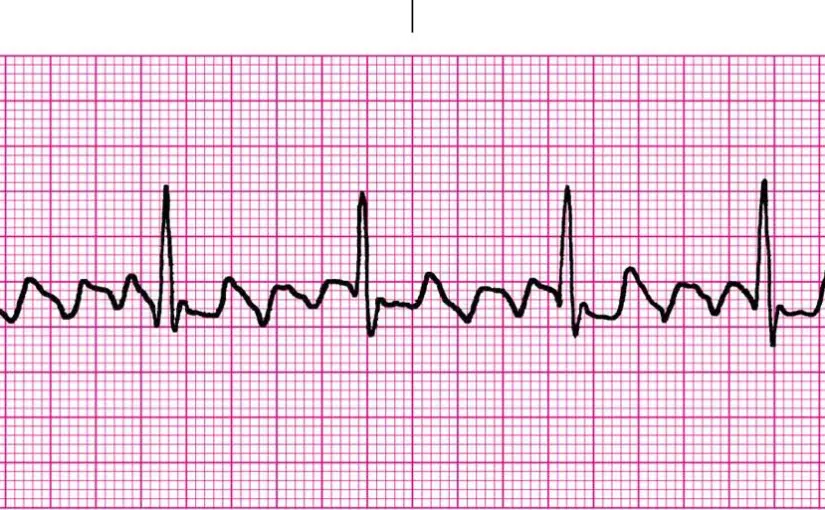
atrial fibrillation

1st degree AV block

2nd degree AV block

3rd degree AV block

premature ventricular complex
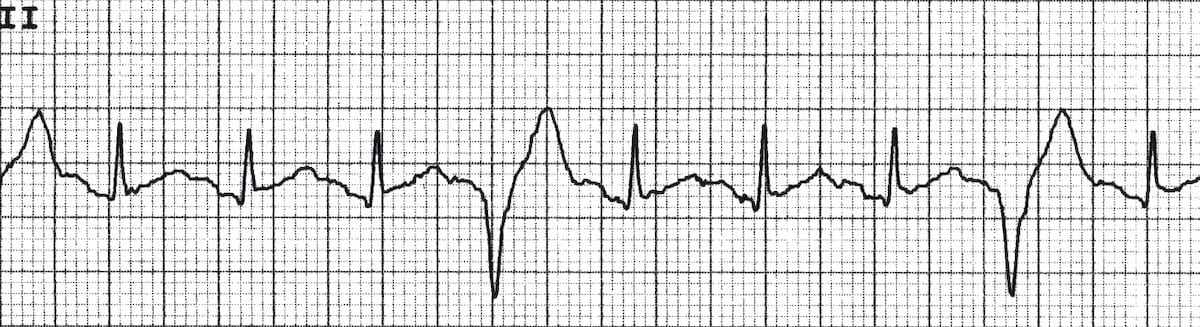
ventricular tachycardia

ventricular fibrillation
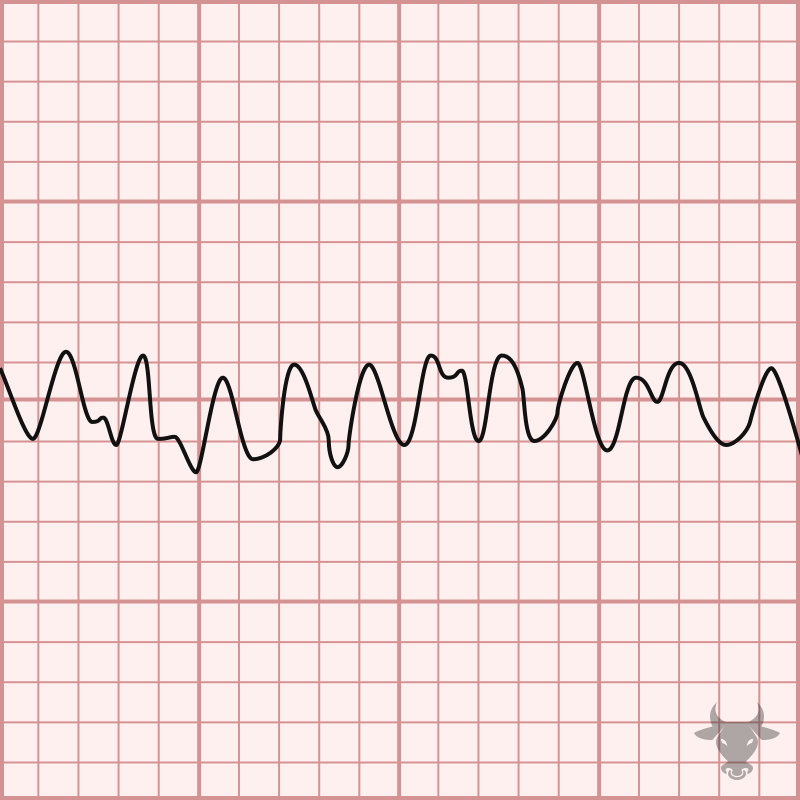
ST elevation
full-wall thickness infarction resulting in no repolarization of any cells
ST depression
semi-wall thickness infarction; some cells do not repolarize
T-wave inversion
result of previous MI; scar tissue results in altered depolarization and conduction, lack of activity in dead tissue