Geography Exam #2
 Call Kai
 Learn
Learn Practice Test
 Spaced Repetition
 Match
Match Flashcards
 Knowt Play
1/77

There's no tags or description
Looks like no tags are added yet.
Name | Mastery | Learn | Test | Matching | Spaced | Call with Kai | Chat |
|---|
No analytics yet
Send a link to your students to track their progress
78 Terms
Importance of Water Vapor
Energy cycle
Water is a greenhouse gas
Transports latent heat
Rain and Snow
Weather Hazards
Adiabatic Processes: Affects air stability
Vapor Pressure
Pressure exerted by water vapor
Clausius-Clapeyron Relationship
Warmer air masses can hold more water vapor
Saturation vapor pressure
maximum capacity of air to hold water vapor
Increases exponentially with temperature
Reason that summer days are often humid
Relative Humidity
water-vapor pressure relative to saturation vapor pressure (%)
Specific Humidity
water-vapor mass relative to total air mass (g H2O / kg air)
Dew Point
Temperature at which air of given vapor pressure becomes saturated (= air reaches 100% relative humidity)
Cloud Formation
Aggregations of small water droplets
They are liquid water, not vapor
Form when air becomes saturated with vapor
Require cloud-condensation nuclei
If air mass exceeds its saturation pressure, water will condense from vapor to liquid → clouds form
Two ways to form clouds
Add moisture
Reduce temperature → Air passes dew point
Cloud Classification
Stratus (layered)
Cumulus (puffy)
Cirrus (wispy)
Each subdivided according to elevation and size
All formed by condensation of water vapor to droplets
Clouds with “nimbus” bring rain
Cumulonimbus are the only ones that produce hail, thunder, and lightning
Atmospheric Stability
Stability- tendency of air parcel to remain in place (stable) or rise upwards (unstable)
Two opposing forces: gravity and buoyancy
Convective circulation is an example of instability (air rising and falling)
Temperature and water vapor
Warming an air mass tends to destabilize air masses (like hot air balloon)
Adding water vapor also tends to destabilize an air mass (Adiabatic process)
Adiabatic processes
processes that occur with no net heat exchange between a parcel of air and environment
Rising parcel → pressure decreases and volume increases (Ideal gas law)
Expansion causes temperature to drop, because expansion of air decreases internal heat energy (gas molecules moving away from each other, lose energy during collisions)
Why moist air cools more slowly
Rising airmass cools (adiabatic pressure)
Cooler airmasses have a lower saturation capacity (Clausius-Clapeyron Relationship)
Water condenses when air reaches saturation (dew point)
Condensing water loses latent heat energy → converts to sensible heat energy → slows rate of cooling
Moist vs. Dry Adiabatic rates
An airmass that is warmer than surrounding air will tend to be buoyant, continue to rise
Because moist air masses cool more slowly, they will rise further
Airmass switches from dry to moist adiabatic rate when it cools and reaches dew point

Environmental Lapse Rate
Lapse rate at particular time and location
Governs the temperature profile
Determines the stability of the atmosphere
Average in Troposphere- 6.4 C / km or 3.5 F / 1000 ft
Thermal Equator
Line connecting zones of maximum surface temp
4 forces that drive atmospheric motion
Gravity and Buoyancy
Pressure Gradient Force
Coriolis Force
Friction
Intertropical Convergence Zone (ITCZ)
Convergence of Hadley Cells, band of persistent clouds right around the equator
Moves seasonally, north in summer, south in winter
Hadley Cells
Heating at equator
Air warms, expands (due to solar heating)
Water evaporates (due to solar heating)
Clouds form as air rises, hits a ceiling (tropopause)
High-altitude air moves away, cools, descends
Descending air warms, absorbs moisture
Lower pressure near surface, higher pressure near the tropopause in these areas

Global Patterns of Surface Air Pressure
Subtropical highs- Descending air from Hadley cell
Polar Lows- Boundary between warm westerlies rising over polar air, stronger in winter
Position changes seasonally
Pressure Belts
Polar High
Subpolar Low
Subtropical High
ITCZ
Subtropical High
Subpolar Low
Polar High
Surface Wind Patterns
Polar Easterlies
Midlatitude Westerlies
Tropical Easterlies
Tropical Easterlies
Midlatitude Westerlies
Polar Easterlies
Areas of weak / variable winds
Doldrums (equator)
Horse Latitudes (subtropics)
Cross-Section of atmosphere patterns

Jet Stream
Bands of high-speed upper-atmosphere air flow, found where pressure gradients are steepest
Example of Geostrophic Flow
Not fixed in one place, moves around with time
Two per Hemisphere
Polar Jet Stream (typically stronger)
Subtropical Jet Stream
Rossby Waves
Giant meanders in the Jet Stream
Caused by upper-atmosphere variations in pressure- highs (ridges north) and lows (troughs south)
Responsible for much of our weekly weather variations
Effects at Earth’s Surface
Upper-air slowing → Upper-air Convergence → Air pushed to surface → Surface High pressure
Upper-air speeds up → Upper-air Divergence → Air pulled away from surface → Surface Lo Pressure
Polar Vortex
Very fast air that moves around the poles in the stratosphere in the winter
Large waves in the polar jet can draw cold air southward into the mid-latitudes (cold air outbreak)
Sea Breezes
Caused by daily differential heating of land/ocean
Day- Land heats faster → hot air rises → low surface pressures → air replaces from ocean. Surface winds move onshore
Night- Reverses, surface winds move offshore
Monsoons
Same process as sea breezes, instead caused by seasonal differential heating of land and ocean
Summer- Surface winds move onshore → lots of rain
Winter- Surface winds move offshore
Air Masses
Regional masses of air with mostly homogenous properties (temperature, humidity, stability)
Air masses are modified as they move
Lake Effect Snow
Example of Air Masses being modified
Air mass picks up moisture and energy from lake, releases snow downwind
North American Air Masses
Continental Arctic (cA)
Continental Polar (cP)
Maritime Polar (mP)
Maritime Tropical (mT)
Continental Tropical (cT)

Purpose of Atmospheric Lifting
Produces clouds and (perhaps) precipitation
Orographic Atmospheric Lifting
Air masses move laterally, pushed up and over mountain
Windward- In the direction of wind flow, distinguished by heavy rainfall
Leeward- Away from the wind flow, distinguished by dry weather
Rain shadow- Dry weather on the leeward side
Chinooks- Warm and dry winds that flow downslope
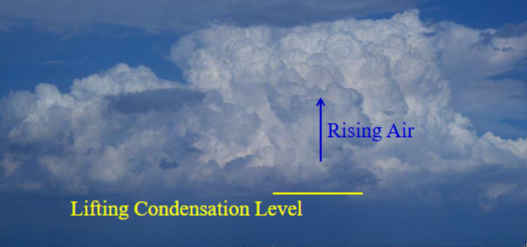
Convectional Atmospheric Lifting
Surface warms, heats air masses, which rise
Convective Storms- Strong surface heating + Unstable atmosphere = Storm
Can be a single cell or cluster, can produce thunder / lightning
Vertical movement caused by surface heating
Stages:
Moist air rises, cool, condenses, releases latent heat
Heavy rain produce downdrifts
Downdrifts weaken and then suppress updraft
Convergent Atmospheric Lifting
Air masses converging on low-pressure zone push air upwards. Important in tropics where temp differences are small.
Related to the ITCZ
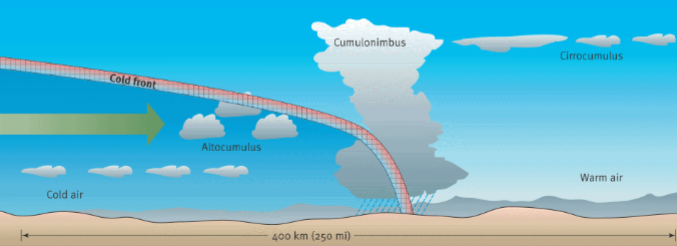
Cold Fronts
Advancing cold air quickly lifts warm air
Steep front → strong precipitation, storms, severe weather
Move relatively fast
Warm Fronts
Advancing warm air slides over cold air
Gradual lifting → drizzle and overcast skies
Move relatively slow

Cyclones
Weather patterns around a low pressure zone
Centered on low pressure zone
Low pressure causes surface convergence
Draws in warm air from south and cold air from north
Cold and warm fronts rotate around central low
Cyclonic Storm Tracks
Carried west to east by westerlies
Moisture sources- Pacific, Gulf of Mexico
Track shifts seasonally
Hurricanes
Intense form of tropical storm
High risk to life and property, due to high wind speeds and storm surges
Formation of Tropical Cyclones
Also start as a line of mild low-pressure, called easterly wave
Air converges on low pressure and rises, creating clouds and thunderstorms
Rising air strengthens the low-pressure systems and air starts to rotate
Formation of Hurricanes
Warm ocean surface generates convection and vertical movement
Moist air condenses and releases latent heat- rain starts
Creates warmer air that is more buoyant and air continues to rise
Rising air causes low-pressure zone at the surface. Winds converge and spiral inwards
Continued convection from the warm ocean surface intensifies storm
Fastest wind and greatest damage often to right of eye and travel path
Spawn in warm subtropical waters, due to warm water with lots of energy and Coriolis rotation
Storm Surge
Water rises due to drop in air pressure and push of water to coast
Importance of the Ocean
Water- Global hydrosphere- 97.2% of water
Carbon- Global carbon cycle- 90% of carbon is in oceans, in intermediate and deep waters
Buffer- Absorbing ~25% of all CO2 we emit from fossil fuels
Energy- Transports about 25% of heat energy to high latitudes
Ocean Vertical Structure
Deep ocean is colder (thermocline), saltier (Halocline), denser (Pycnocline), darker

Ocean’s two layers
Shallow mixed ocean (top 100-150m)
Circulation driven by wind
Well-mixed
Sunlit → Photosynthesis
Deep ocean (below 100m)
Circulation driven by density gradients
Slow circulation (1000 yrs)
Ocean temperature at different latitudes
Ocean sea surface temps show a clear latitudinal gradient- warmest at equator, coldest at poles.
Therefore, thermal stratification is strongest in low latitudes, weakest at poles

Ocean Surface Circulation
Wind-driven
In Tropics- winds cause water divergence
In Subtropics- winds cause water convergence
Dominated by subtropical gyres

Ekman Spiral
Wind drags ocean surface
Surface drags subsurface
Water is deflected by Coriolis

Gyres
large, circular ocean currents centered on subtropical convergence
Five subtropical gyres dominate ocean circulation

Gulf Stream
Western arm of North Atlantic Gyre
Carries heat from equator to Arctic and warms Europe and coastal North America

Major warm ocean currents
East Australian Current
Kuroshio Current
Gulf Stream
Upwelling
Process in which cold, deep water is brough to the surface
Coastal upwelling
Wind + Coriolis force pushes surface water away from coastline
Allows deep, nutrient-rich water to upwell
Deep Ocean Circulation
Driven by density gradients
Linked together into one “global conveyor belt”
Called the “Thermohaline Circulation”
Meaning it is driven by temperature and salinity
Slow- takes about 1000 years for deep ocean to complete 1 cycle
In most areas, stable stratification prevents overturning
Ways to make ocean surface water dense enough to sink
Make it colder
Make it saltier
Ice formation and brine exclusion (poles)
Evaporate lots of water (Mediterranean)
Most deep water formation occurs at poles
Ocean Acidification
Oceans absorb 1/4 to 1/3 of CO2 that we release
Good- “ocean sink” slows down rater of climate change
Bad- Added CO2 increases the acidity of oceans
Ocean acidification
CO2 and water react to form Carbonic Acid (H2CO3)
Carbonic Acid dissolves to release hydrogen ions
Recall that acidity measures the concentration of H+ in liquid
Ocean Acidity has increased over the last 20 years
Ocean pH has increased by 0.1
26% increase in concentration of hydrogen ions
A problem because H+ reacts with and removes Co3-2 which many species use to build their shells
Uses of Surface Water
Agriculture
Drinking water
Power plant cooling
Mining and Manufacturing
Recreation
Hazards of Surface Water
Flooding
Droughts
Mudslides and Landslides
Hydrologic Cycle
Precipitation transfers water from atmosphere to ocean and land (supply)
Evaporation transfers water from oceans and land to atmosphere (demand)
Transpiration transfers water from plants to atmosphere (demand)
Runoff transfers water from land to oceans. Rechange soil and groundwater includes transfer of water within soil column (surplus)
Surface Water Balance - Precipitation
Highest in tropics due to ITCZ + Hadley Cells
Also high in subtropical regions where monsoons are strong
(In US) high in the Pacific Northwest and Eastern US, caused by moisture advection from oceans, mountain rain shadows
Atmospheric Rivers- Narrow plumes of water vapor carried by the westerlies
Ex: Pineapple Express in California
One atmospheric river can carry more water than the Amazon river
Surface Water Balance - Evapotranspiration
Evaporation and Transpiration, often combine into Evapotranspiration
Evapotranspiration Global Patterns
Highest in areas with heat and plenty of water, subtropical oceans
Lowest in areas with low water availability, under the descending limb of Hadley Cell, or cold areas, the poles.
PET- Potential Evapotranspiration
“Potential” means maximum possible, given unlimited water supply
Highest when high temps, high sunlight, and windy.
AET- Actual Evapotranspiration
Actual ET, limited by supply of water
Highest in warm areas with high water availability
AET is always less than or equal to PET
Water Balance
Deficits and Surpluses result from imbalances between supply and demand
Deficits cause water loss from land surface, reductions in surface, soil, and groundwater reserves
Surpluses can go to stream runoff, rechange soil moisture, recharge groundwater.
Runoff is high when precipitation is high (tropics, coasts), and ET is low (arctic).
Supply > Demand = Surplus
Demand > Supply - Deficit
Percolation
The gravitational pull of water downwards through pore spaces in soil and rock
Porosity
The amount of pore space in rock or sediments
Permeability
The degree of connectedness among pores
Ex: Swiss cheese, High Porosity, Low Permeability
Types of water in soil
Hygroscopic Water- Bound too tightly to soil particles for plants to access
Capillary water- Most accessible to plants
Gravitational water- Escapes down too quickly for plants to access
Grain sizes in soil
Coarse sand- Pore spaces big, high gravitational water loss
Fine grains (clay)- pore spaces small, mostly hydroscopic water
Silt- Grain sizes between sand and clay
Loams- Mixture of clay, silt and sand (ideal)
Groundwater Recharge
Water that percolates down through soil enters the groundwater
Vadose Zone vs. Saturated Zone
V- Mixture of air and water in the ground
S- All pores filled by water in the ground
Water Table
Top of the saturated zone of the ground
Basic Behavior of Ground Water
Water flows by gravity, pulled downwards
Flow is slow due to high friction, can take decades
Water table surface mostly follows contours of land surface
Wells create cones of depression, lowered water table
Aquifers vs. Aquicludes
Aquifers- Permeable rocks and sediments, reservoirs of groundwater
Unconfined Aquifers- Permeable sediments and rocks above
Confined Aquifers- Capped by impermeable layer of rock
Aquicludes- Impermeable rocks and sediments
Groundwater Issues
Groundwater Mining- When rate of water pumping is higher than rate of recharge
Groundwater Contamination- When toxic materials are introduced into groundwater
Landfills, Agricultural runoff, Septic tanks, Industrial waste, Oil and gas drilling.
Fracking- Fracturing rocks underground to increase permeability, return natural gas
A slurry of water, chemicals, and sands pumped underground to fracture rocks
Will these chemicals and natural gas contaminate groundwater?
Aridity vs. Drought
Aridity- Long-term scarcity of water (Saharan desert)
Drought- Short-term lack of water (Wisconsin sometimes experiences)
Effects of climate change on water
Warming increases moisture transport, making wet seasons and events wetter
Warming increases evaporative demand and drought severity
Wet get wetter, Dry get dryer