Biostatistics 2
 Call Kai
 Learn
 Practice Test
 Spaced Repetition
 Match
 Flashcards
 Knowt Play
1/73

There's no tags or description
Looks like no tags are added yet.
74 Terms
main types of statistics
1. Descriptive Statistics
2. Inferential Statistics
Descriptive Statistics
Collection organization, summarization, and presentation of data
Inferential Statistics
Generalizing from samples to populations
• Performing estimates
• Hypothesis testing
• Determining relationships between variables
• Making predictions
Population
the entire set of measurement for a given parameter (N)

Sample
those measurements actually made (n)

Parameter versus Statistic
Measure of population is called a parameter
Measure of sample is called a statistic
sampling unit
the individual elements in the population (a person, family, city etc....)
random sampling
random sample: sampling units are selected independently one at a time
in a random sample, all sample sizes of n have an equal probability of being chosen from the population
best estimate of the population mean
is the mean of the sample
population mean
μ, a parameter

sample mean
x̅, a statistic

reliability of the estimate of the population mean
related to the standard error of the mean
population standard deviation
σ, a parameter

sample standard deviation
S, a statistic

estimating population variability
using STD
- standard deviation of the sample is a biased estimate of the standard deviation of the population
- A better estimate of the standard deviation of the population can be obtained
Degrees of Freedom (df)
- often used in inferential statistics
- does not have to be n-1
- can be n-1, n-2, n-3, etc....
- depends on how many parameters are free to vary

sample standard deviation statistic
s (little s)
- in almost all cases the data will be closer to the sample mean than the population mean
- How far away data is from sample mean will be smaller than how far away data is from population mean
Sample STD (S) -> underestimates population standard deviation
Sample STD statistic (S) -> uses a smaller denominator and compensates for this underestimate
- df = correction factor
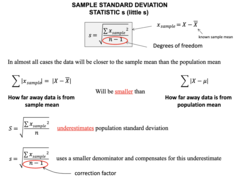
In almost all cases the data will be closer to the ___ mean than the ___ mean
sample > population
SUMMARY EQUATIONS TO DATE
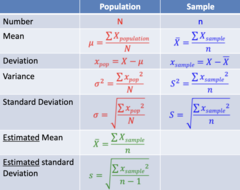
What is the best estimate of the population mean?
sample mean
Distributions of sample means

width of distribution of means indicates?
amount of confidence

sampling distribution variables
μx̄ = mean of sample means
μ = population mean
X̄ = sample mean

Sampling Distribution
A distribution comprising estimates of some property of a population
Examples:
• frequency distribution of means of different samples
• frequency distribution of standard deviations of different samples
• frequency distribution of modes of different samples

Sampling Error
Dispersion of the estimates
Examples:
• How different sample means are from one another
• How different sample standard deviations are from one another
• How different sample modes are from one another

Standard Error
Measure of that dispersion
Examples:
• Standard deviation of a set of sample means
• Standard deviation of a set of sample standard deviations
• Standard deviation of a set of sample modes

central limit theorem steps
1. Consider a population with a known distribution that is not necessarily Gaussian
2. Randomly pick many samples of equal size from that population
3. Tabulate the means of these samples
4. Graph the frequency distribution of the means
central limit theorem
1. As the sample size n increases, the shape of the distribution of the sample means will approach a Gaussian distribution, even if the population is not Gaussian
2. The mean of the distribution of sample means will equal the mean of the population
= μ
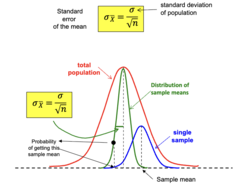
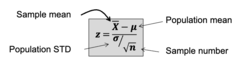
3. The standard deviation of the distribution of sample means will equal the population standard deviation divided by the square root of n (equation pictured)

Standard error of the mean
the dispersion of the distribution of sample means
- denoted S.E.
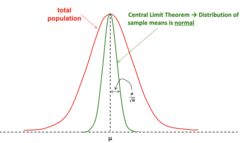
central limit theorem states that the distribution of sample means is what kind of distribution?
normal distribution
- Valid if population is normal for any value of n or for n>30 if population not normal
Many statistical tests (i.e. for example a t test) are concerned with measurements of?
sample means
- these statistical tests work even if the population distribution is not normal or Gaussian
central limit theorem variables
μx̄ - mean of distribution of means
μx - population mean
σx̄ - standard deviation of distribution of means
σX - Standard deviation of population
X̄ - sample mean
n - sample number
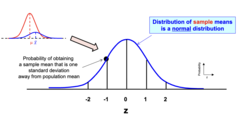
The probability of finding a given sample average can be determined using a?
normal z distribution

determining a confidence interval

concept of a confidence interval

confidence interval limits
1. lower limit
2. upper limit
ex. What is the confidence that population mean is between 115.3 and 115.7?
115.3 = lower limit
115.7 = upper limit
confidence interval probability

statement of confidence
There is a __% probability that the population mean lies within ___ and ___
confidence interval
lower limit
upper limit

Confidence level
confidence level of an interval estimate of a parameter, is the probability that the interval estimate will contain the parameter
- given either as a decimal or percentage
ex. The confidence level is 95% that the population mean is between 115.3 and 115.7
- Statement of Confidence
Confidence Level Assumptions
1. a large number of samples are selected
2. The estimation process of the same parameter is repeated
confidence interval
a specific interval estimate of a parameter determined by using data obtained from a sample and by using the specific level of the estimate
ex. The 95% confidence interval is 115.3 to 115.7
confidence levels with different confidence intervals
The bigger the interval the greater the probability that the population mean will lie within that interval

confidence levels with different standard errors
The smaller the standard error the better the estimate of the mean

confidence interval is determined by?
standard error of the mean and confidence level

basis for confidence intervals
a normal distribution of sample means
- Valid because of the central limit theorem
Specified confidence interval →
calculate confidence level (%)
Specify desired confidence level (%) →
calculate confidence interval
Critical value
z value that determines the confidence interval
formula for confidence intervals

STANDARD CONFIDENCE LEVELS

relationship between confidence level and ⍺
confidence level of an interval estimate of a parameter, is the probability that the interval estimate will contain the parameter
- the percentage equivalent to the decimal value of 1 - ⍺
⍺ is the sum of the areas of the two tails

Confidence interval method is valid for:
1. Population standard deviation, σ, is known and sample size is 30 or more
2. Population standard deviation, σ, is known and population is normally distributed
(sample size can be less than 30)
Normal distribution described is called a z distribution

EFFECT OF SAMPLE SIZE n ON STANDARD ERROR OF THE MEAN

maximum error of estimate and sample size

t-distribution
- a family of curves
- Each curve is for a different degree of freedom
- Degree of freedom depends on sample size

normal distribution at different z values
- Normal distribution is larger at z=0
- Normal distribution is smaller at large positive or negative z

what happens to the t-distribution value as n and df increases?
gets smaller and approaches normal distribution
n - sample size
df - degrees of freedom

t distribution vs z distribution: similarities
• Both are bell-shaped
• The mean, median, and mode are equal to 0 and located at the center of the distribution
• The curve never touches the x-axis
• Both are symmetric about the mean
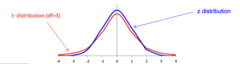
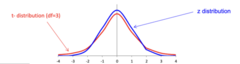
t distribution vs z distribution: differences
• The t distribution is a family of curves related to sample size (degrees of freedom -df)
• The variance of the t distribution is greater than 1 (variance of normal distribution is 1)
• The variance of t distribution depends on degrees of freedom
• As the sample size increases the t distribution approaches the standard normal distribution
confidence interval for t distribution
t distribution area will be greater compared to z distribution
- Greater area means less confident that value will be within confidence interval
- use 2 tails
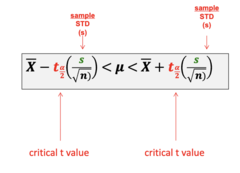
t distribution vs z distribution: 99% confidence interval
z distribution: corresponds to z = 2.58
- critical z value
t distribution: corresponds to t = 3.707
- critical t value
- Less confidence with a t-test due to smaller sample size

when to use z or t distribution
z distribution:
- σ known
- Either n≥30 or normally distributed if n

x^2 distribution
- Start with a normally distributed population
- Repeatedly take random samples
- measure the standard deviation
parameter: ((n-1)s^2)/(σ^2)
- follows an x^2 distribution

x^2 distribution areas
shaded area:
- equal to percentage equivalent of ⍺
- the x2 value we are looking for
= x^2 = x^2⍺
if the area is to the right (x → ∞) → value is given by the table (lower)
= x^2 right
if the area is to the left (0 → x) →
value is = 1 - value given by the table (upper)
= x^2 left
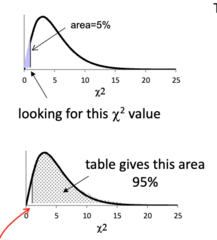
x^2 confidence intervals

x^2 confidence interval formula

x^2 confidence interval variance

x^2 confidence interval standard deviation

critical values of each distribution

table comparisons
Tables contain:
1. Area
2. z, t or x2 value
z table:
• z value is in first column and first row
• Area is in table
t,x2 table:
• Areas are in top row
• df is in first column
• t value, x2 value is in table

SUMMARY DISTRIBUTIONS

what are the tests for a mean?
1. z test
2. t test
what are the tests for significance of a difference between two means?
1. z test
2. t test
other tests of hypothesis
1. Multi-mean comparisons: Analysis of variance (ANOVA): F test
2. Comparison of frequencies: Chi-Square (x2)