Epidemology: Morbidity & Mortality

0.0(0)
Studied by 0 people
call kaiCall Kai
learnLearn
examPractice Test
spaced repetitionSpaced Repetition
heart puzzleMatch
flashcardsFlashcards
GameKnowt Play
Card Sorting

1/72

flashcard set

Earn XP

Description and Tags

measuring morbidity (תחלואה), meaning the occurrence of disease, and mortality (תמותה), meaning deaths in a population.

73 Terms

1
New cards

Population אוכלוסייה

a group of people who share a defined characteristic, such as hospital patients, kindergarten children, or factory workers.

<p>a group of people who share a defined characteristic, such as hospital patients, kindergarten children, or factory workers. </p>
2
New cards

Population at risk אוכלוסייה בסיכון

 individuals who could develop the specific outcome being investigated or those exposed to a particular risk factor.

<p><span>&nbsp;</span>individuals who could develop the specific outcome being investigated or those exposed to a particular risk factor. </p>
3
New cards

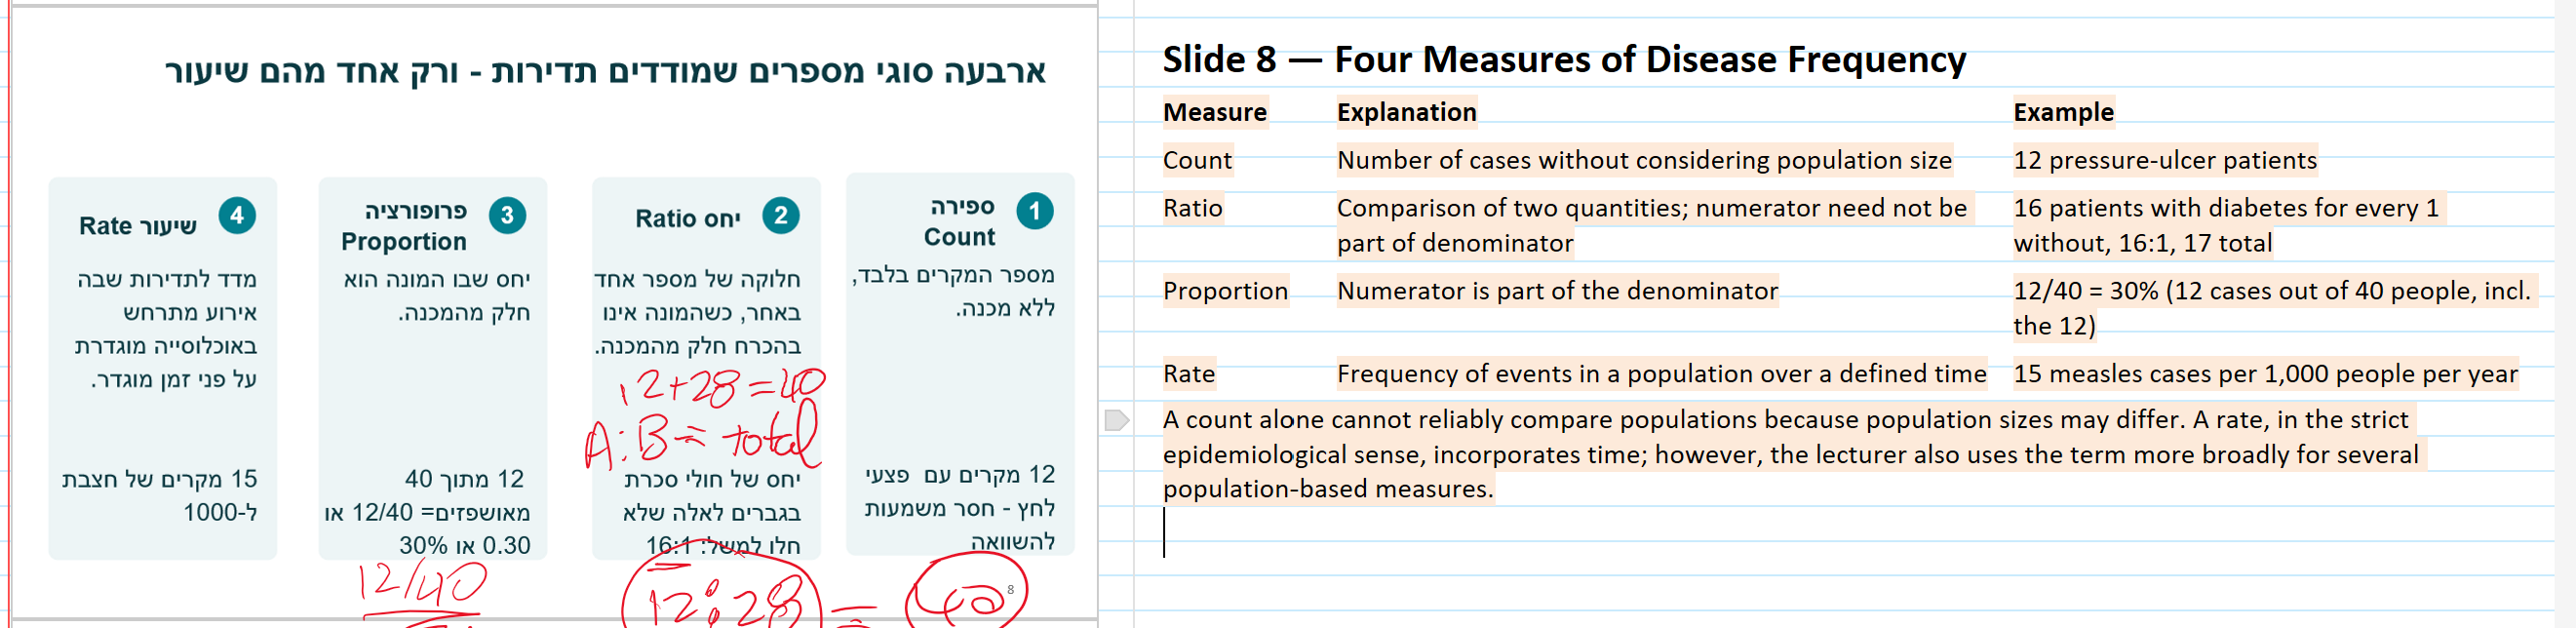
Count

Number of cases without considering population size (12 pressure-ulcer patients)

<p><span style="background-color: rgb(253, 234, 218);">Number of cases without considering population size (12 pressure-ulcer patients)</span></p>
4
New cards

Ratio

Comparison of two quantities (16 patients with diabetes for every 1 without, 16:1, 17 total)

<p><span style="background-color: rgb(253, 234, 218);">Comparison of two quantities (16 patients with diabetes for every 1 without, 16:1, 17 total)</span></p>
5
New cards

Proportion

Numerator is part of the denominator

12/40 = 30% (12 cases out of 40 people, incl. the 12)


<table style="min-width: 50px;"><colgroup><col style="min-width: 25px;"><col style="min-width: 25px;"></colgroup><tbody><tr><td colspan="1" rowspan="1" style="border-width: 0pt; vertical-align: top; width: 2.5743in; padding: 4pt;"><p><span style="background-color: rgb(253, 234, 218);">Numerator is part of the denominator</span></p></td><td colspan="1" rowspan="1" style="border-width: 0pt; vertical-align: top; width: 3.377in; padding: 4pt;"><p><span style="background-color: rgb(253, 234, 218);">12/40 = 30% (12 cases out of 40 people, incl. the 12)</span></p></td></tr></tbody></table><p></p>
6
New cards

Rate

Frequency of events in a population over a defined time

15 measles cases per 1,000 people per year


<table style="min-width: 50px;"><colgroup><col style="min-width: 25px;"><col style="min-width: 25px;"></colgroup><tbody><tr><td colspan="1" rowspan="1" style="border-width: 0pt; vertical-align: top; width: 3.6895in; padding: 4pt;"><p><span style="background-color: rgb(253, 234, 218);">Frequency of events in a population over a defined time</span></p></td><td colspan="1" rowspan="1" style="border-width: 0pt; vertical-align: top; width: 2.8291in; padding: 4pt;"><p><span style="background-color: rgb(253, 234, 218);">15 measles cases per 1,000 people per year</span></p></td></tr></tbody></table><p></p>
7
New cards
Rate formula (נוסחת שיעור)
Number of people experiencing an event ÷ population at risk × 1,000 (or another specified multiplier). Add formula image: Slide 10.
8
New cards
Rate: numerator and denominator (מונה ומכנה)
The numerator and denominator must refer to the same population, location, and time period.
9
New cards
Incidence (היארעות)
The number of NEW cases of a disease in a defined population during a specified period. Measures disease occurrence and risk.
10
New cards
Cumulative Incidence (היארעות מצטברת)
The proportion of initially disease-free people who develop a disease during a defined follow-up period.
11
New cards
Cumulative Incidence formula (נוסחת היארעות מצטברת)
New cases during the period ÷ population initially at risk × 1,000 (or another specified multiplier). Add image: Slide 12.
12
New cards
Why calculate person-time? (למה מחשבים זמן-אדם?)
Because individuals may enter or leave a study at different times, so not everyone contributes the same amount of follow-up time.
13
New cards
Person-time (זמן-אדם)
The total amount of time that all participants contribute while being at risk of developing the disease.
14
New cards
Person-year (שנת-אדם)
One person followed for one year equals 1 person-year. One person followed for five years equals 5 person-years.
15
New cards
Person-time Incidence Rate (שיעור היארעות לפי זמן-אדם)
A measure of how quickly NEW cases occur, accounting for differences in the amount of time individuals are followed.
16
New cards
Person-time Incidence Rate formula (נוסחת היארעות לפי זמן-אדם)
Number of new cases ÷ total person-time at risk × specified multiplier. Report as cases per 100 or 1,000 person-years. Add image: Slide 17.
17
New cards
Person-time calculation example (דוגמה לחישוב זמן-אדם)
2 new cases during 15 person-years = (2 ÷ 15) × 100 = 13.3 cases per 100 person-years. Add image: Slide 18.
18
New cards
Cumulative incidence vs. person-time incidence (היארעות מצטברת מול היארעות לפי זמן-אדם)
Cumulative incidence divides new cases by people initially at risk; person-time incidence divides new cases by total time at risk.
19
New cards
Incidence calculation example (דוגמה לחישוב היארעות)
397 new diabetes cases among 2,017 women = (397 ÷ 2,017) × 1,000 = approximately 197 per 1,000. Add image: Slide 21.
20
New cards
Why is incidence important? (למה חשוב למדוד היארעות?)
Identifies populations at risk, evaluates primary prevention, estimates the risk of developing disease, and helps investigate disease causes (etiology).
21
New cards
Attack Rate (שיעור התקפה)
A measure of cumulative incidence used mainly during outbreaks to determine the proportion of exposed individuals who become ill.
22
New cards
Attack Rate formula (נוסחת שיעור התקפה)
Number of exposed individuals who became ill ÷ total number exposed × 100. Add image: Slide 23.
23
New cards
Attack Rate: outbreak example (דוגמה לשיעור התקפה)
176 of 226 people who ate egg salad became ill (77.9%), compared with 27 of 73 who did not (37%). This suggests a possible food source.
24
New cards
Prevalence (הימצאות / שכיחות)
The proportion of a defined population that has a disease, including both new and existing cases. Measures disease burden rather than risk.
25
New cards
Point Prevalence (הימצאות נקודתית)
The proportion of a population that has a disease at one specific point in time.
26
New cards
Period Prevalence (הימצאות תקופתית)
The proportion of a population that had the disease at any time during a specified period, such as a month or year.
27
New cards
Prevalence formula (נוסחת הימצאות)
Existing cases at a specified point ÷ total population at that time × 1,000 (or another specified multiplier). Add image: Slide 24.
28
New cards
Point Prevalence calculation (חישוב הימצאות נקודתית)
Jerusalem: 73,000 people with diabetes ÷ 1,046,300 residents × 1,000 = 69.8 per 1,000 residents. Add image: Slide 27.
29
New cards
Change in prevalence: calculation (חישוב שינוי בהימצאות)
(73,000 − 1,500 deaths + 5,000 new cases + 750 immigrants) ÷ 1,063,000 × 1,000 = 72.7 per 1,000. Add image: Slide 28.
30
New cards
Why is prevalence important? (למה חשוב למדוד הימצאות?)
Measures the total burden of disease, supports healthcare planning and resource allocation, and helps evaluate secondary prevention.
31
New cards
Incidence vs. Prevalence (היארעות לעומת הימצאות)
Incidence counts NEW cases and measures disease risk. Prevalence includes ALL existing cases and measures disease burden.
32
New cards
Relationship between incidence and prevalence (הקשר בין היארעות והימצאות)
Prevalence ≈ Incidence × Average disease duration. This approximation applies when disease occurrence is stable, prevalence is low, and migration is balanced.
33
New cards
Does higher prevalence mean higher disease risk? (האם הימצאות גבוהה מעידה על סיכון גבוה?)
No. Higher prevalence may result from longer disease duration or improved survival, even when fewer new cases develop.
34
New cards
Tuberculosis: two cities example (דוגמת השחפת בשתי ערים)
Hitown has higher prevalence (100/1,000) but lower incidence (4/1,000/year). Lotown has lower prevalence (60/1,000) but higher incidence (20/1,000/year). Add image: Slide 31.
35
New cards
Incidence and prevalence: Gordis diagram (תרשים הקשר בין היארעות והימצאות)
Incidence adds new cases to the pool; recovery and death remove cases. Prevalence represents the existing pool of disease. Add Gordis diagram: Slide 32.
36
New cards
What increases prevalence? (מה מעלה הימצאות?)
New cases entering the population and longer survival or disease duration increase the number of people living with a disease.
37
New cards
What decreases prevalence? (מה מוריד הימצאות?)
Recovery, death, or fewer incoming cases can reduce the number of existing disease cases.
38
New cards
What affects measured incidence? (מה משפיע על היארעות?)
Migration, new methods of early disease detection, and differences or problems in documenting and reporting new cases.
39
New cards
What makes incidence and prevalence difficult to calculate? (קשיים בחישוב היארעות והימצאות)
Changing disease definitions, missed cases, different data collection methods, incomplete follow-up, and changes in population size.
40
New cards
Annual Mortality Rate (שיעור תמותה שנתי)
The number of people who die during a calendar year relative to the population at risk, generally estimated using the mid-year population.
41
New cards
Annual Mortality Rate formula (נוסחת שיעור תמותה שנתי)
Deaths during the year ÷ mid-year population × specified multiplier. For the lecturer's cause-specific example, count deaths from the specified condition. Add image: Slide 37.
42
New cards
Crude Mortality Rate (שיעור תמותה גולמי)
The total number of deaths from ALL causes in a population during a defined period, relative to the average population size.
43
New cards
Crude Mortality Rate formula (נוסחת שיעור תמותה גולמי)
Deaths from all causes ÷ average population during the period × specified multiplier. Add image: Slide 38.
44
New cards
Crude Mortality calculation (חישוב שיעור תמותה גולמי)
Israel, 2006: 38,765 deaths ÷ 7,053,700 people × 100,000 ≈ 550 deaths per 100,000. Add image: Slide 39.
45
New cards
Specific Mortality Rate (שיעור תמותה סגולי)
A mortality rate calculated for a specific cause of death or population subgroup, such as a particular age group or sex.
46
New cards
Specific Mortality Rate formula (נוסחת שיעור תמותה סגולי)
Deaths in the specified category ÷ corresponding population at risk × multiplier. The numerator and denominator must match. Add image: Slide 40.
47
New cards
Case Fatality Rate (שיעור קטלניות)
The proportion of people diagnosed with a particular disease who die from that disease during a specified period. Reflects disease fatality among cases.
48
New cards
Case Fatality Rate formula (נוסחת שיעור קטלניות)
Deaths from a particular disease among diagnosed cases ÷ total diagnosed cases × 100. Add image: Slide 41.
49
New cards
Case Fatality vs. Mortality Rate (שיעור קטלניות לעומת שיעור תמותה)
Mortality rate measures deaths relative to the population at risk. Case fatality measures deaths relative to people who HAVE the disease.
50
New cards
Case Fatality calculation (דוגמה לחישוב שיעור קטלניות)
18 of 20 patients with disease X die: CFR = 18/20 × 100 = 90%. In a population of 100,000, cause-specific mortality = 18 per 100,000. Add image: Slide 42.
51
New cards
Proportionate Mortality (תמותה פרופורציונלית)
The percentage of ALL deaths in a population that are attributable to a particular cause. It does not measure the population's risk of death.
52
New cards
Proportionate Mortality formula (נוסחת תמותה פרופורציונלית)
Deaths from a specific cause ÷ total deaths from all causes × 100. Add image: Slide 43.
53
New cards
Years of Potential Life Lost - YPLL (שנות חיים אבודות)
A measure of premature mortality that calculates the number of potential years of life lost when someone dies before a predefined reference age.
54
New cards
YPLL calculation in Israel (חישוב שנות חיים אבודות בישראל)
Reference age = 75 years. YPLL = 75 − age at death (if below 75). Death at age 1 = 74 years lost; at age 40 = 35 years lost. Add image: Slide 45.
55
New cards
Total YPLL (סך שנות חיים אבודות)
The sum of all individual years of potential life lost from a particular cause of death.
56
New cards
Why examine mortality rates? (למה חשוב לבדוק שיעורי תמותה?)
To assess disease burden, identify mortality trends and population differences, evaluate prevention and treatment, and guide public health decisions.
57
New cards
Age Standardization (תקנון גיל)
A statistical method that adjusts for differences in age distribution so mortality rates can be compared more fairly between populations.
58
New cards
Why can crude mortality rates be misleading? (מדוע שיעורי תמותה גולמיים עלולים להטעות?)
A population with more older people may have higher crude mortality even when its age-specific mortality rates are lower.
59
New cards
Age-specific mortality comparison (השוואת תמותה סגולית לפי גיל)
Compare deaths within the SAME age groups. On slide 49, Hospital B has higher mortality in every age group despite having lower crude mortality. Add image: Slide 49.
60
New cards
Standardization / Adjustment (תקנון / התאמה)
A statistical method used to control for differences between populations, especially age, by comparing them using a common reference structure.
61
New cards
Direct Standardization (תקנון ישיר)
Applies each population's actual age-specific mortality rates to the SAME standard population to obtain comparable adjusted mortality rates.
62
New cards
Direct Standardization: four steps (ארבעת שלבי התקנון הישיר)
1. Calculate age-specific rates. 2. Choose a common standard population. 3. Calculate expected deaths in each age group. 4. Divide total expected deaths by standard population × multiplier. Add image: Slide 52.
63
New cards
Direct Standardization: expected deaths (תקנון ישיר - פטירות צפויות)
For each age group: standard population × age-specific mortality rate ÷ rate multiplier. Example: 8,000 × 10 ÷ 1,000 = 80 expected deaths. Add image: Slide 54.
64
New cards
Direct Standardization: final calculation (תקנון ישיר - חישוב שיעור מתוקנן)
Total expected deaths ÷ total standard population × 1,000. Hospital A: 740/20,000 × 1,000 = 37.0; Hospital B: 846/20,000 × 1,000 = 42.3. Add image: Slide 55.
65
New cards
Why is a standardized rate hypothetical? (מדוע שיעור מתוקנן הוא היפותטי?)
It applies real rates to a selected standard population rather than describing actual observed mortality. Its value depends on the chosen standard.
66
New cards
Indirect Standardization (תקנון עקיף)
A method that applies known reference population mortality rates to the age distribution of the study population to calculate expected deaths.
67
New cards
When is indirect standardization used? (מתי משתמשים בתקנון עקיף?)
When the study population is small or has too few deaths to calculate reliable age-specific mortality rates.
68
New cards
Indirect Standardization: procedure (כיצד מבצעים תקנון עקיף?)
Apply reference age-specific rates to the study population to calculate expected deaths, then compare expected deaths with the actual observed deaths. Add image: Slide 57.
69
New cards
Standardized Mortality Ratio - SMR (יחס תמותה סטנדרטי)
The ratio of observed deaths to expected deaths based on reference mortality rates, usually expressed as a percentage.
70
New cards
SMR formula (נוסחת יחס תמותה סטנדרטי)
SMR = Observed deaths ÷ Expected deaths × 100. Add image: Slide 58.
71
New cards
How to interpret SMR (כיצד מפרשים SMR?)
SMR = 100: as expected. SMR > 100: more deaths than expected. SMR < 100: fewer deaths than expected. Example: 150 means 50% more deaths.
72
New cards
SMR calculation example (דוגמה לחישוב SMR)
69 observed deaths ÷ 46 expected deaths × 100 = SMR 150, meaning 50% more deaths than expected after accounting for age. Add image: Slide 59.
73
New cards
Does SMR > 100 prove poor care? (האם SMR מעל 100 מוכיח טיפול לקוי?)
No. It indicates excess mortality compared with expectations, but other factors such as disease severity and comorbidities must be investigated.