Lecture 6: ECGs
 Call Kai
 Learn
Learn Practice Test
 Spaced Repetition
 Match
Match Flashcards
 Knowt Play
1/38

Earn XP
Description and Tags
help me HELP HELP EHCEIWOCHEDWEU MEOWOWO MEOW MEOW MEOW HELP PHOSPHOLAMBAM SAEEV ME
Name | Mastery | Learn | Test | Matching | Spaced | Call with Kai | Chat |
|---|
No analytics yet
Send a link to your students to track their progress
39 Terms
P wave
atrial depolarization
P wave normal duration
0.08-0.10 seconds
QRS complex
ventricular depolarization
QRS complex normal duration
0.06-0.10 seconds
T wave
ventricular repolarization
duration not normally measured
PR interval
time from atrial depolarization onset to ventricular depolarization onset
“atrial depolarization + AV nodal”
PR interval normal duration
delay 0.12-0.20 seconds
3 to 5 small squares on ECG paper
ST segment
the period at which the entire ventricle is depolarized and corresponds to the plateau phase of the ventricular action potential
beginning: end of QRS
end: beginning of the T wave
elevation/depression of this is IMPORTANT
duration not normally measured
QT interval
estimates duration of ventricular action potentials
QT interval normal duration
0.20-0.40 seconds
high heart rates reduce action potential duration and therefore the QT interval
ECG interpretation
clinician evaluates cardiac rhythms by recording rhythm strip via ECG (usually use LEAD II)
sinus rhythm
when P waves (atrial depolarizations) lead directly to QRS complexes (ventricular depolarizations) in a 1:1 fashion
normal rate: 60-100bpm
sinus tachycardia
100+ bpm
sinus bradycardia
lower than 60 bpm
QRS interpretation
amplitude >0.5 mV in at least one standard lead; upper limit of normal amplitude = 2.5-3.0 mV
small septal Q waves amplitude are less than 1/3 amplitude of the R wave
ST segment interpretation
isoelectric, slanting upwards to the T wave in the normal ECG
can be slightly elevated (up to 2.0 mm in some precordial leads)
never normally depressed >0.5mm in any lead
T wave interpretation
normally rounded and asymmetrical with a more gradual ascent than descent
isolated T wave inversion in an asymptomatic adult is generally a normal variant
influences on ECG waveform
location of electrodes
conduction pathways and conduction speed
changes in muscle mass
location of electrodes
changes the viewing angle and distance to the heart, which directly alters the shape, direction, and size of the recorded waveform
conduction pathway and speed
dictate the timing, shape, and duration of every wave and interval
changes in muscle mass
an increase or decrease in the thickness and mass of the heart wall changes the strength and timing of the electrical vector
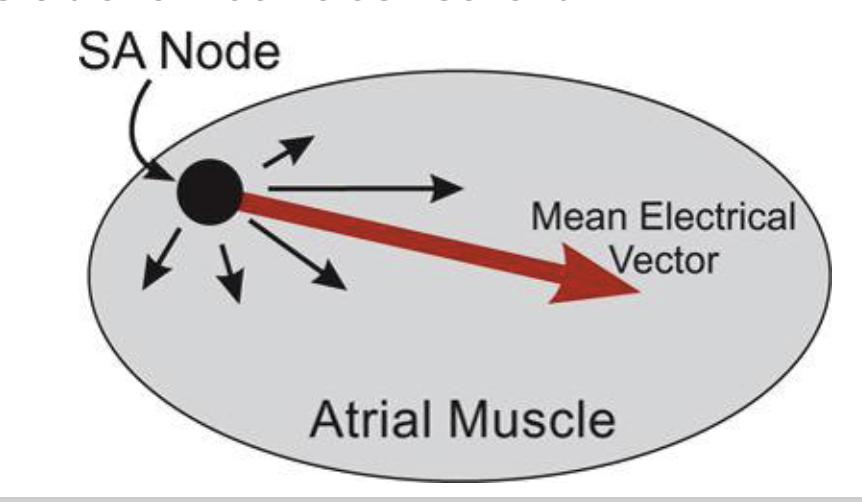
vectors
represent both the size (magnitude/voltage) and direction of electrical force generated by heart muscle cells
mean electrical axis
represents the average direction of electrical current flow (the QRS vector) during ventricular depolarization
used diagnostically to identify left and right axis deviations
“the summative, average vector of all instantaneous vectors combined during ventricular depolarization”
direction of mean electrical vector relative to positive and negative electrodes
determines polarity of waveform and magnitude of waveform
positive deflection on ECG
an electrical wave moving toward a positive electrode
negative deflection on ECG
an electrical wave moving away from a positive electrode
biphasic
perpendicular wave (- and + summed close to 0)
5 rules of interpreting an ECG
wave of depolarization traveling toward positive electrode → positive deflection
wave of repolarization traveling toward + electrode → negative deflection
wave of depolarization/repolarization perpendicular to electrode axis → no NET deflection
amplitude of measured potentials depends on orientation of positive electrode relative to mean vector
voltage amplitude ± is related to mass of tissue undergoing depolarization/repolarization
lead I
has positive electrode on left arm and negative electrode on right arm
0 degrees
measures potential difference across the chest between the two arms
lead II
positive electrode is on left leg and negative electrode is on right arm
+ 60 degrees
lead III
has positive electrode on left leg and negative electrode on left arm
+ 120 degrees
aVL
left arm: -30 degrees
aVR
right arm: -150 degrees
aVF
foot: +90 degrees
mean electrical axis (w/ axial ref system)
corresponds to axis that is perpendicular to lead axis with smallest net QRS amplitude
perpendicular to most biphasic lead
accurately estimate exact axis and determine deviation
ST segment elevation
full wall MI
ST segment depression
myocardial ischemia
tissue hypoxia caused by ischemia
results in membrane depolarization → as ATP levels decline, there is a net loss of K+ as it leaks out of the cell = decreased activity of the Na+/K+ ATPase pump → alters pacemaker activity, leading to changes in rhythm and ectopic beats
cellular hypoxia
results in accumulation of intracellular calcium
leads to afterdepolarizations and tachycardia