Stat- Chapter 2 Descriptive Statistics
 Call Kai
 Learn
 Practice Test
 Spaced Repetition
 Match
 Flashcards
 Knowt Play
1/25

There's no tags or description
Looks like no tags are added yet.
26 Terms
Mean
measure of center
adding all x values and dividing by the total n

Summation Symbol
adding terms
i=5 = 0+1+2+3+4+5=15

median
the middle value when the original data is arranged in increasing (or decreasing) order
mode
the most frequently occurring data value.
variance
measurement of dispersion across a data set
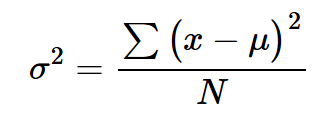
standard deviation
how much the values in a dataset vary from their mean
68% 95% 99%
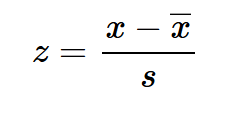
Z-score
The -score converts a data value to a standardized scale
-= data is less then mean
+=data is greater then mean
unitless
Percentiles
divide the data into 100 groups of about 1% of the data in each group
p1, p2, p3.. p99
Quartiles
divide the data into 4 groups with about 25% of the data in each group
Q1,Q2,Q3
P25 = Q1 (lower quartile)
P50 = Q2 (median)
P75 = Q3 (upper quartile)

5 # summary
1)minimum
2) Q1
3)Q2
4)Q3
5)maximum
this can be used to make a boxplot
sample space
the set of all possible outcomes
ex. Rolling 1,2,3,4,5 or 6 dots with a single roll of a die.
event
a specific collection of such outcomes.
ex: Getting more than 3 dots when rolling a die.
Probability
that an event has occured or will occure

empirical probability
Empirical probability is the likelihood of an event estimated by dividing the number of times it occurs by the total number of trialsE
Complementary rule
the probability of an event not occurring is P(A′)=1−P(A)
union of 2 events
For any two events, if A or B or both occur, the probability is written as p(A or B) or the union of the events P(A u B) ano of the above

Intersection of 2 events
For any two events, if A and B occur, the probability is written as P(A and B) or the intersection of the events P(A n B)
🔗

mutually exclusive
If the events A and B have no overlap they are disjoint, or mutually exclusive

Addition rule
P(A or B) = P(A) + P(B)
Conditional Probability
porbabiltiy of event B occuring given that A has already occured = P (B/A) and vise versa
Independent events
one event doesnt affect the probability of the other P(A) = P(B/A)
Multiplication or production rule
P(A AND B) = P(A) X P(B/A)
independent events : P(A and B) = P(A) x P(B)
Permutations
The number of arrangements when r items are selected, without replacement, from a set of n items

!
factorial symbol

Combinations
set collection of r items to be selected without replacement from a set of n items. Order or arrangement of the items does not matter

random variable
A random variable returns a single numerical value as an outcome of a specific random experiment. Random variables are classified as discrete or continuous. Example: the number of dots when rolling a single die.