Transducing of Light Energy into Electrical Energy
 Call Kai
 Learn
Learn Practice Test
 Spaced Repetition
 Match
Match Flashcards
 Knowt Play
1/21

There's no tags or description
Looks like no tags are added yet.
Name | Mastery | Learn | Test | Matching | Spaced | Call with Kai | Chat |
|---|
No analytics yet
Send a link to your students to track their progress
22 Terms
Receptors have outer segments, which contain:
Visual WHAT molecules, which have two components:
WHAT, a large WHAT
WHAT, a light-sensitive molecule
Receptors have outer segments, which contain:
Visual PIGMENT molecules, which have two components:
OPSIN, a large PROTEIN
RETINAL, a light-sensitive molecule
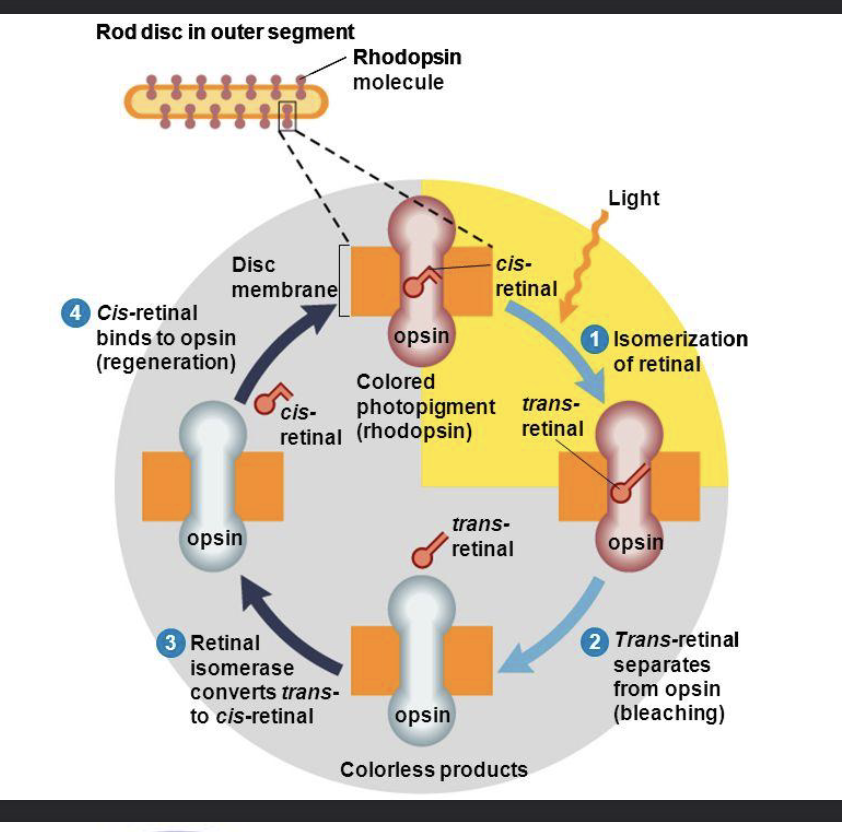
Visual transduction occurs when the retinal absorbs a WHAT.
The retinal changes its WHAT, which is known as WHAT.
Visual transduction occurs when the retinal absorbs a PHOTON.
The retinal changes its SHAPE, which is known as ISOMERIZATION.
How do we see light
(a) Cis-retinal
(b) Isomerization: WHAT-retinal becomes WHAT- retinal.
(c) WHAT & WHAT break apart. The retina becomes WHAT
How do we see light
(a) Cis-retinal
(b) Isomerization: CIS-retinal becomes TRANS- retinal.
(c) RETINAL & OPSIN break apart. The retina becomes BLEACHED

Wald’s visual cycle:
George Wald (1906- 1997) was awarded the Nobel Prize for his discovery of this cycle.
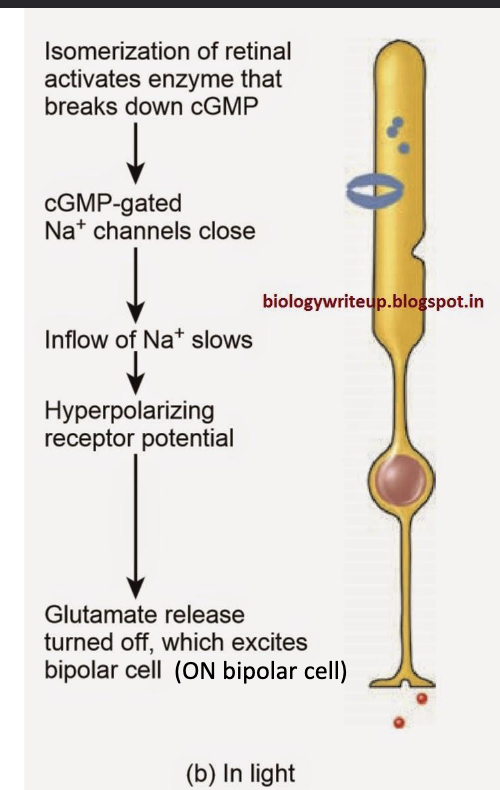
Isomerization of WHAT activates enzymes that break down WHAT
cGMP-gates WHAT channels close
Inflow of Na+ slows
WHAT receptor potential
WHAT release is turned off, which excites the WHAT cell (ON bipolar cell)
Isomerization of RETINAL activates enzymes that break down cGMP
cGMP-gates Na+ channels close
Inflow of Na+ slows
HYPERPOLARIZING receptor potential
GLUTAMATE release is turned off, which excites the BIPOLAR cell (ON bipolar cell)
Dark center, light surround
Cone WHAT
Glutamate WHAT
Excites WHAT bipolar cell
Dark center, light surround
Cone DEPOLARIZE
Glutamate RELEASED
Excites OFF bipolar cell

light center, dark surround
Cone WHAT
Glutamate WHAT
Excites WHAT bipolar cell
light center, dark surround
Cone HYPERPOLARIZED
Glutamate RELEASE DECREASES
Excites ON bipolar cell

Light turns on an WHAT bipolar and WHAT ganglion cell
Light turns on an ON bipolar and ON-CENTER ganglion cell

What are the three experiments used to measure the dark adaptation curve
Experiment measuring WHAT adaptation
Experiment measuring WHAT adaptation
Experiment measuring WHAT and WHAT adaptation
What are the three experiments used to measure the dark adaptation curve
Experiment measuring CONE adaptation
Experiment measuring ROD adaptation
Experiment measuring CONE and ROD adaptation
Method using all three experiments
Observer is WHAT adapted
Light is turned WHAT
Once the observer is WHAT adapted, they adjust the WHAT of a test light until they can just WHAT
Method using all three experiments
Observer is LIGHT adapted
Light is turned OFF
Once the observer is DARK adapted, they adjust the INTENSITY of a test light until they can just SEE IT
Experiment for cone adaptation
Observer looks at a test light WHAT such that the test light stimulates only the WHAT in the fovea.
Sensitivity increases for WHAT to WHAT minutes and then WHAT (green curve).
Threshold WHAT; sensitivity WHAT
Experiment for cone adaptation
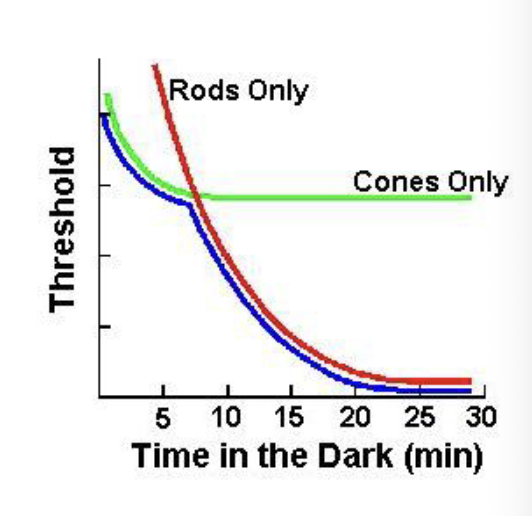
Observer looks at a test light DIRECTLY such that the test light stimulates only the CONES in the fovea.
Sensitivity increases for THREE to FOUR minutes and then LEVELS OFF (green curve).
Threshold DECREASES; sensitivity INCREASES

Experiment for rod adaptation
Must use a rod WHAT (a person with no WHAT).
Sensitivity WHAT (i.e., threshold decreases) for about WHAT minutes and then levels off (red curve)
Experiment for rod adaptation
Must use a rod MONOCHROMAT (a person with no CONES).
Sensitivity INCREASES (i.e., threshold decreases) for about 25 minutes and then levels off (red curve)
Experiment for rod and cone adaptation
Observer looks at a fixation point but pays attention to a test light to the side.
The test light falls on the WHAT retina, which contains both WHAT and WHAT.
Sensitivity displays a two-stage WHAT curve (the blue curve)
Experiment for rod and cone adaptation
Observer looks at a fixation point but pays attention to a test light to the side.
The test light falls on the PERIPHERAL retina, which contains both RODS and CONES.
Sensitivity displays a two-stage ADAPTATION curve (the blue curve)

Experiment for rod and cone adaptation
Sensitivity increases in WHAT stages.
Stage one takes place for WHAT to WHAT minutes.
Then sensitivity levels off for WHAT to WHAT minutes – the rod-cone WHAT
Stage two shows increased sensitivity for another WHAT to WHAT minutes.
Experiment for rod and cone adaptation
Sensitivity increases in TWO stages.
Stage one takes place for THREE to FOUR minutes.
Then sensitivity levels off for SEVEN to TEN minutes – the rod-cone BREAK
Stage two shows increased sensitivity for another 20 to 30 minutes.

Explaining the two-stage dark adaptation curve
Our sensitivity to light depends on the concentration of the WHAT (WHAT).
The speed at which our sensitivity increases in the dark depends on the WHAT of the visual pigment (WHAT retinal becomes WHAT retinal again).
Explaining the two-stage dark adaptation curve
Our sensitivity to light depends on the concentration of the VISUAL PIGMENT (CIS-RETINAL).
The speed at which our sensitivity increases in the dark depends on the REGENERATION of the visual pigment (TRANS retinal becomes CIS retinal again).
Explaining the two-stage dark adaptation curve
Cone pigment takes WHAT minutes to regenerate completely.
Rod pigment takes more than WHAT minutes to regenerate completely.
Explaining the two-stage dark adaptation curve
Cone pigment takes 6 minutes to regenerate completely.
Rod pigment takes more than 30 minutes to regenerate completely.
Spectral Sensitivity
WHAT of rods and cones to different parts of the visual spectrum
Use monochromatic light to determine the WHAT at different WHAT.
Threshold for light is lowest in the WHAT of the spectrum.
WHAT = sensitivity, which produces the spectral sensitivity curve.
Spectral Sensitivity
SENSITIVITY of rods and cones to different parts of the visual spectrum
Use monochromatic light to determine the THRESHOLD at different WAVELENGTHS.
Threshold for light is lowest in the MIDDLE of the spectrum.
1/threshold = sensitivity, which produces the spectral sensitivity curve.

Rod spectral sensitivity
More sensitive to WHAT light
Most sensitive at WHAT nm
Rod spectral sensitivity
More sensitive to SHORT-WAVELENGTH light
Most sensitivity at 500 nm
Cone spectral sensitivity
Most sensitive at WHATnm
Cone spectral sensitivity
Most sensitive at 560nm
Purkinje shift
Enhanced sensitivity to short wavelengths during dark adaptation when the shift from cone to rod vision occurs
Spectral Sensitivity
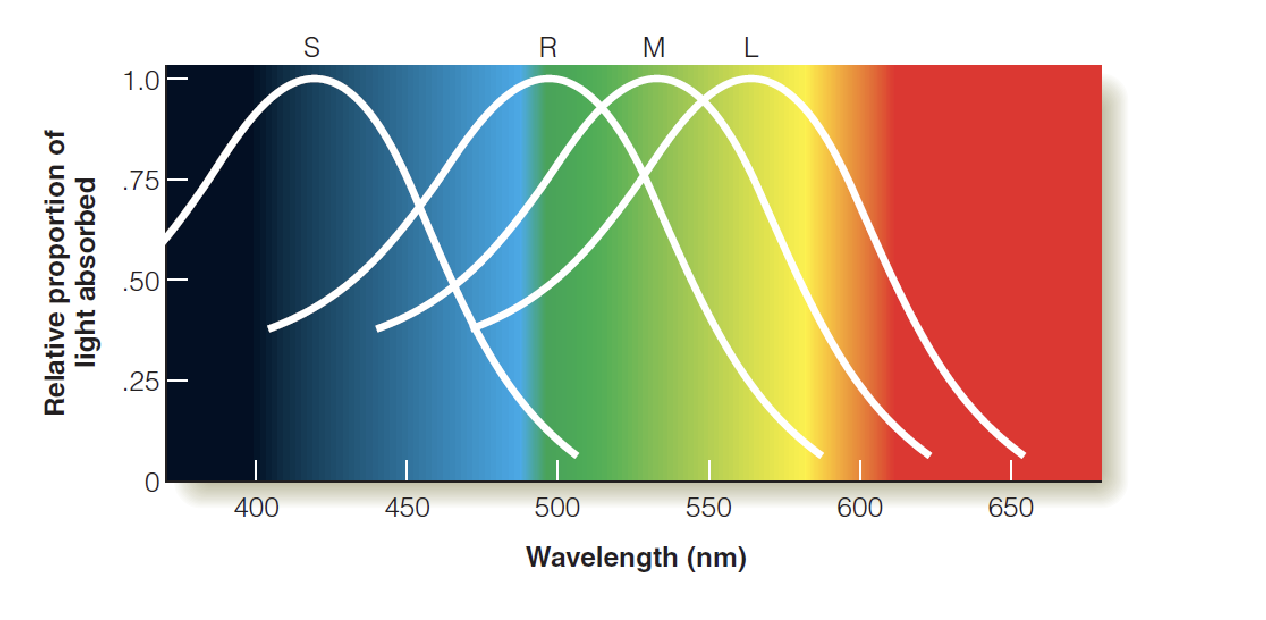
Difference in spectral sensitivity is due to WHAT of visual pigments.
Rod pigment absorbs best at WHAT nm.
Cone pigments absorb best at WHATnm, WHATnm, and WHATnm.
Absorption of all cones equals the peak of WHATnm in the spectral sensitivity curve
Spectral Sensitivity
Difference in spectral sensitivity is due to ABSORPTION SEPCTRA of visual pigments.
Rod pigment absorbs best at 500 nm.
Cone pigments absorb best at 419nm, 531nm, and 558nm.
Absorption of all cones equals the peak of 560nm in the spectral sensitivity curve

Spectral sensitivity was discovered by WHO
Spectral sensitivity was discovered by GEORGE WALD