QMB 3602 Exam 2 UCF
 Call Kai
 Learn
 Practice Test
 Spaced Repetition
 Match
 Flashcards
 Knowt Play
1/93

There's no tags or description
Looks like no tags are added yet.
94 Terms
Management Dilemma
What are the symptoms that are causing management to investigate an issue?
Management Question
How can management eliminate the symptoms or capitalize on the opportunity?
Research Question
- Questions that explore the various options
- These also form the hypotheses that best states the objective of the research
Investigative Question
- Represents the information that the decision maker needs to know
- Ex: what is the publics opinion on a product?
Measurement Question
- Questions that participants in the research are asked/what is observed in the research
- These questions are the actual data
Types of Management Questions:
1. Evaluation of Solutions
2. Choice of Purpose
3. Troubleshooting
4. Control
What type of management question is this:
How can we achieve the objectives we have set?
- Evaluation of solutions
What type of management question is this:
What do we want to achieve?
- Choice of purpose
What type of management question is this:
Why is our program not meeting its goals?
- Troubleshooting
What type of management question is this:
How well is our program meeting its goals?
- Control
Exploration
loosely defined research with a clear purpose
Tertiary Source
an interpretation of a secondary source
Literature Search
a review of literature related to a management dilemma
Books and journals are _________ sources
published
raw data, dictionaries, and handbooks are _________ sources
external
Data warehouse typically store large amounts of ________ data
internal
Source Evaluation for internal sources is based off:
compatibility (w/ question)
timelessness (less affected by time = better)
recentness
quality
authors
Decision Variable
- A quantifiable characteristic, attribute, or outcome on which a decision is made
- We can have one or more of these
Decision Rule
The criteria for judging the attractiveness of 2 or more alternatives when using a decision variable
Ex Post Facto Evaluation
refers to determining the value of research AFTER the research has been conducted
If a decision could have been made without research, the value of the research is _________
negative
Task Budget
- Dollars usually drawn from a discretionary reserve of an organization/budget of in-house operation.
Functional Area Budget
- Dollars drawn from a portion of the manager's business unit's operational fund.
- Manager can spend the budgeted amount how they wish
Ethical Issues in Stage 1
- Regardless of organizational structure, the manager has the most control over stage 1 so it is important that it is carried out ethically
DMP stands for
Data Management Platform
First party data is another term for ______ ______
primary data
Stratification
- Separates data so that it is easier to see and make sense of
- This can be used when there are multiple sets of data overlapping on a graph
- Ex: data may be categorized by color
(T/F) It is easier to implement stratification after data has been collected.
False
It is much easier to use stratification before collecting data
Check Sheet
- aka defect concentration diagram
- for visual refer to module 5 (ch4 textbook)
Instrument Disposition
the process(es) by which the measurement instrument is returned to the researcher
Data Entry
converts data gathered by secondary or primary methods into a medium for data viewing and manipulation
Data Fields
- Represent variables
- Ex: response to question
- Can contain numbers, words, images, etc.
Data Records
- Represent rows in a data file
- A set of data for one case (participant)
- All your answers in a survey would represent your data record
Data File
- ALL the responses by ALL participants in a study
Database
- Stores files
- Basically, a set of all records
3 Types of Data Units:
context units
sampling units
recording units
Context Units
refer to the content that directly relates to the objective of research
Sampling Units
- refer to what text elements the researcher will code
- Ex: words, phrases, sentences
Recording Units
refer to the ideas, topics, or themes that are embedded in the text
- there are 4 types:
1. syntactical
2. referential
3. propositional
4. thematic
Syntactical Units
- The exact, author defined, words and phrases
- We are interested in the meaning of the words and phrases in context
Referential Units
- Describe objects by using words or phrases
- Used to make inferences about opinions of participants
Propositional Units
- Are assertions about an object
- Ex: you will save $15 if you do this....
- "save" is the propositional unit
Thematic Units
- Topics contained within (and across) text
- These represent higher level abstraction
- Look for things that repeat
Content Analysis Software uses statistical algorithms to permit:
stemming
aliasing
excluding
Stemming
- searches for all the forms of a key word (stem)
- Ex: searching, searches, search, searched
Aliasing
- Searches for synonyms
- Ex: wise, smart, intelligent
Excluding
- Filters out trivial words
- Ex: be, is, the, of
Editing refers to
- Process for verifying that variables are used and entered correctly
- Ensures completeness and accuracy
"Don't Know" Responses
are difficult to interpret because they could mean a variety of things
Missing data may be caused by
- participants intentionally or accidentally skipping
- research error
- malfunctioning software
- changes in design
- participants dropping out of the study
MCAR
- refers to data missing COMPLETELY at random, not correlated to another variable
MAR
- refers to data missing at random, not correlated
NMAR
- refers to data missing but not at random
3 Methods to salvage missing data:
Listwise Deletion
Pairwise Deletion
Predictive Replacement
Listwise Deletion
An entire case with a missing variable (data) is deleted from all analyses that involve that variable
Pairwise Deletion
- We replace the missing data with an estimate
- May be replaced by the mean or another measure
Predictive Replacement
- Replaces missing data based off the value of another variable
Sources of bias:
- Asking misleading questions
- Forged data
- Data entry
Data Validation
- A process for verifying research protocols that avoid errors and confirm data is real
- Identifies fake or inaccurate data
Exploratory Data Analysis (EDA)
explores and reduces data using statistical methods
Confirmatory Data Analysis (CDA)
- Required when attempting to prove causation
- has something to do with significance and confidence but not really sure
Frequency Table
- tells us how many times a value occurs
- can also be in a graphical form such as bar chart or pie chart

Histogram
- groups variables into intervals
- shows a distribution

Stem and Leaf Display
shows quantitative data values in a way that sketches the distribution of the data
- a numerical version of a histogram
***(If you turn the picture sideways, it is a histogram)***

Pareto Diagram
A histogram, ordered by frequency of occurrence, that shows how many results were generated by each identified cause.

Boxplot
Boxplots display a 5 number summary which is:
- Median
- Upper quartile
- Lower quartile
- Largest observation (max)
- Smallest observation (min)

Resistant Statistics
- stats not affected by outliers
- Ex: median, upper & lower quartile
An outlier is defined as a data point that exceeds interquartile range by _______ times
1.5
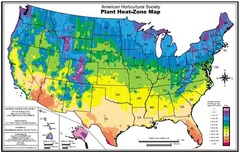
Mapping
a map...
Cross Tabulation
a method of analyzing data that lets the analyst look at the responses to one question in relation to the responses to one or more other questions
Control Variable
- A variable introduced to help interpret the relationship between variables
Blue cells are _____ cells
data
Yellow cells are _______ cells
changing
Output cells
show the quantities calculated from changing cells
Orange cells are _____ cells
objective
Feasible Region
feasible region is the area that satisfies every constraint

Constraint Boundary Line
- the line of the constraint boundary equation
Constraint Boundary Equation
- the equation that defines the constraint line
- Ex: 3D + 2W = 18
3D + 2W = 18
What does D and W equal?
D:
3D ≤ 18
D ≤ 6
W:
2W ≤ 18
W ≤ 9
(T/F) Constraints are represented by _________ cells
output
5 Types of Linear Programming Problems
- Resource-Allocation Problems
- Cost-Benefit Tradeoff Problem
- Mixed Problems
- Transportation Problems
- Assignment Problem
Resource Allocation Problems
- involves the allocation of an organization's resources
- a resource can be anything from cash to production materials
- has a resource constraint
Resource Constraint (≤)
Amount of resource used ≤ Amount resource available
- this means we can only use up to a certain amount of resources until we run out
****the ≤ tells you that it is a resource constraint
Cost Benefit Tradeoff Problem
- different from resource allocation because we determine our goal and use as few resources as possible to achieve it rather than having a predetermined amount of resources
- has benefit constraint(s)
Benefit Constraint (≥)
Level achieved ≥ Minimum acceptable level
- this means we need to be greater than or equal to the minimum acceptable level that was determined
****the ≥ tells you it is a benefit constraint
Mixed Problem
- a linear programming problem that includes at least 2 of the 3 types of functional constraints (resource, benefit, fixed-req)
Fixed Requirement Constraint (=)
Amount provided = Required amount
*** the = sign is the identifying factor
Transportation Problem
- involves finding a shipping plan that minimizes total cost of transporting products to customers
- normally need 2 types of constraints
***look for words such as "shipping" or "transport"
Assignment Problem
- involves assigning people to tasks to minimize the total cost of the tasks
- Which people are assigned to which task?
****look for words like "assign" "roles"
Characteristics of any linear programming model
Linearity
Finiteness
Non-negativity
Linearity refers to
the fact that the relationship between 2 or more variables should be linear
Finiteness refers to
the fact that the solution will not be optimal if there is an infinite number of factors
Non-Negativity refers to
the fact that the variable should be positive or 0, not negative
Model Enrichment
The process of using experience with a model to identify and add important details that will provide a better representation of the real problem