ISE 477- Study Guide Exam 1
 Call Kai
 Learn
Learn Practice Test
 Spaced Repetition
 Match
Match Flashcards
 Knowt Play
1/49

There's no tags or description
Looks like no tags are added yet.
Name | Mastery | Learn | Test | Matching | Spaced | Call with Kai | Chat |
|---|
No analytics yet
Send a link to your students to track their progress
50 Terms
Simulation
imitation of the operation of a real‐world process or system over time
System
set of related components working together toward some purpose over time
examples of areas that simulation can be applied to.
Airports (terminal transport),
manufacturing (optimizing line),
Hospital (disaster planning)
Predictive-"What COULD happen?"
Prescriptive- “What SHOULD we do?"
Descriptive- “what happenED?”
⭐Describe the difference between predictive, prescriptive and descriptive mode
Predictive
Get Insight Into Future Outcomes;
What COULD happen?"
Prescriptive
Get Insight Into the Best Possible Outcome
What SHOULD we do?"
Descriptive
Get Insight Into Past Outcomes
“what happenED?”

Simulation process

Deterministic models- don’t involve randomness;
Stochastic models- involve randomness'
What is the difference between a deterministic and stochastic model?
Deterministic models
- DON’T involve randomness
Stochastic models
- involve randomness
Static simulation models represent a certain point; don’t involve time
dynamic simulation- Represents the system over time; involves time
What is the difference between static and dynamic simulation models?
Static simulation models
represent a certain point
don’t involve time
dynamic simulation-
Represents the system over time;
involves time
Verification- does what we say the model is doing
Validation- correctness of the model/data
What is the difference between verification and validation?
Verification
- does what we say the model is doing
Validation-
correctness of the model/data
discrete event simulation
Dynamic, discrete-change, stochastic simulation models.
measures of risk- Likely and Unlikely values
measures of error- accuracy and inaccuracy of values
What are measures of risk vs. measures of error?
measures of risk
- Likely and Unlikely values
measures of error-
accuracy and inaccuracy of values
the more replications, the smaller the confidence interval
What is the effect of increasing replications?
Queue disciplines
how a server decides what specific entity in the queue will be chosen to move into service next.
FIFO: First-In, First-Out
LIFO: Last-In, First-Out
Reciprocals(inverse value) of each other
Arrival Rate (λ): The number of arrivals that happen per unit of time (e.g., customers per hour).
Interarrival Time (I): The amount of time that passes between one arrival and the next
Service Rate (μ): The number of customers or items a server can process per unit of time (e.g., servers completed per hour).
Service Time (S or 1/μ): The total time it takes to finish servicing a single customer or item once service begins.
relationship between interarrival times and arrival rates along with service times and service rates
Stable if the utilization is p <1
how to determine if a queueing system is stable or not?
Maybe I haven’t run it enough
The model might be wrong
The expectation might be wrong
What are the possible causes if the model results do not match the expectation?
minimize error
Confidence Interval is to?
Continuous time simulation- State variables can change continuously over time
Discrete Time simulation- state variables can change only at instantaneous points in time.
What is the difference between continuous and discrete time simulations
Continuous time simulation-
State variables can change continuously over time
Discrete Time simulation
- state variables can change only at instantaneous points in time.
Describe the common events which would cause a transition to another state.
Arrivals,
departures,
processing,
arriving in queue
Ways to troubleshoot if the results of a model do not match the expected results? (simio)
Look at error bar, to identify the error
Check for typos
Watch the simulation animations
Go to the simio help desk
Depends on the situation
How to determine an appropriate run length for a simulation? (simio)
Connectors require no travel time; paths include travel time
what is the difference between connector and path in Simio.
Ex
Random.Exponential(mean)
ServerName.InputBuffer.Contents
DefaultEntity.Population.TimeInSystem.Average
Simio’s dot notation. Understand the Simio Expressions that we’ve covered in class.
This is because even though it is random, you are running the same experiment with the same values. So you’ll get the same random results unless a variable is changed.
Why do we get the same random results in Simio if we construct the same model?
Small, built-in example models in Simio designed to illustrate how to accomplish specific modeling tasks or concepts
Tech support, mini modules to help people when they are stuck on certain problems
What is Simbit used for in Simio?
Output analysis and experimentation
❓what type of information a simulation will output.
assumptions of a Jackson Network
Poisson process
Independently and exponentially distributed service times.
Probabilistic routings.
Infinite queue capacities.
Utiliaztion p <1

⭐Units
(Wq)- Time in queue (excluding service time)
(W)- Time in system
(Lq)- Number of entities in queue; ex custmor in queue
(L) Number of entities in system ex custmor in system
Queueing forumla cheat sheet

Arrival Rate (λ):
The number of arrivals that happen per unit of time
ex unit. arrival/hour
λ=h20

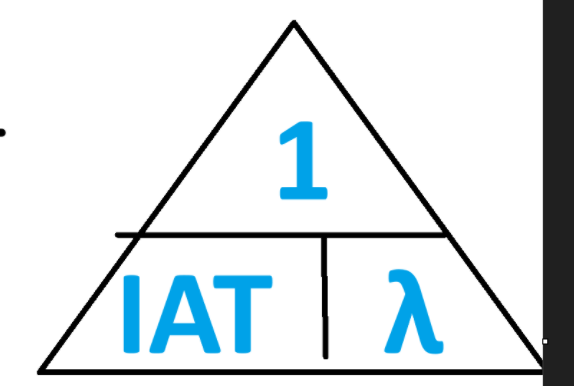
Interarrival Time (I ,IAT, 1/λ):
The amount of time that passes between one arrival and the next
Unit:
IAT=λ1
IAT= InterArravial Time
λ= arrival rate
**make sure to convert units to hour and vis versa
Service Rate (μ):
The number of customers or items a server can process per unit of time
ex unit. servers/hour= 20/h

Service Time (S or 1/μ):
The total time it takes to finish servicing a single customer or item once service begins.
ST=μ1
St= service time
μ= service rate

ρ
Utilization ()
ρ=c⋅μλ
ρ = utilization
λ= arrival rates
μ= service rates
c= servers
ρ<1 ;= stable
ex queueing system
Consider an M/M/2 queueing system having 10 arrivals per hour and a mean service time of 10 minutes. What is the utilization of this system?
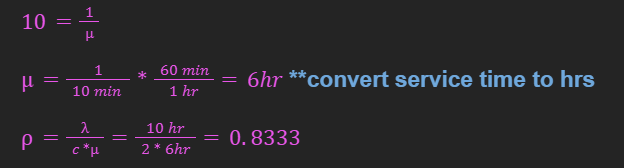

ex queueing system
Given an M/M/1 queue with utilization of 75%, what is the mean number of customers in the system? What is the mean number of customers in the queueing area?


steps for manual discrete calendar
Time- only times when something is happening
Event- arrivals or completion for item
Queue- only add to queue if something is in service
Service- whats being processed
Arrival- Next arrival on the list
Complete- the thing in service+ st
