Research methods
 Call Kai
 Learn
 Practice Test
 Spaced Repetition
 Match
 Flashcards
 Knowt Play
1/23

There's no tags or description
Looks like no tags are added yet.
24 Terms
Quantitative psychological research tend to fall into one of three categories:
Difference —> is one group of people different to another in some way
Association → is one construct related to another
Prediction → does one construct influence another
Aim of psychological research projects
To make inferences (suggestions or claims) about a population.
Population
Everyone of interest to a research question
In other words it is the research question that defines the population
For example: a study may investigate wellbeing in university students. In this case, the corresponding population would be all people who are university students.
Key measures of central tendency and variability
Central tendency → mean
Variability → standard deviation
The 2s rule of thumb
In a distribution with a normal shape, 95% of scores fall within approximately 2 standard deviations of the mean (critical limits)
Everything inside these two scores is considered ‘typical’
Everything outside these two scores is considered extreme

Z-scores
A z-score is a standardized version of a raw score (x) that gives information about the relative location of that score within its distribution.
z scores will tell us how far the score is away from the mean in units of standard deviations and in what direction.
A positive sign (or no sign) indicates that the score is above the mean and on the right-hand side or upper end of the distribution
A negative sign tells you the score is below the mean and on the left- hand side or lower end of the distribution.
The magnitude of the number tells you, in units of standard deviations, how far away the score is from the center or mean. The magnitude can take on any value between negative and positive infinity, but generally fall between −3 and 3.

The formulas for transforming z to x
Another convenient characteristic of z scores is that they can be converted into any “scale” that we would like.
Here, the term scale means how far apart the scores are (their spread) and where they are located (their central tendency).
This can be very useful if we don’t want to work with negative numbers or if we have a specific range we would like to present.

Emprical rule
68% of scores fall between z = −1 and +1.
95% fall within ±2 standard deviations.
99.7% fall within ±3 standard deviations.
Z-scores and Area Under the Curve
Z-score: Indicates a value's position in a normal distribution, measured in standard deviations from the mean.
Standardisation: Converting scores into z-scores to transform any normal distribution into a standard normal distribution.
Area under the curve (AUC): Represents the proportion of scores within a specified range of z-scores.
Total area under the curve = 1.00 (100%).
Tails: The area outside a specified range of z-scores. Can be calculated by subtracting the area within the range from 1.00.
Example:
Area between z = −1 and +1 = 0.68 (68%).
Area outside this range = 1 − 0.68 = 0.32 (32%).
Each tail contains 0.16 (16%), because the normal distribution is symmetrical.

What is probability
The likelihood that a specific event will occur under given conditions.
Expressed as a value between 0 and 1 (0%–100%).
How is probability calculated

Probability in pie charts
Probability of selecting a category = proportion of the pie chart it occupies.
Probabilities of multiple categories can be added together.
Total area = 1 (100%).
Probability in normal distributions
Area under the normal curve represents probability.
Total area under the curve = 1 (100%).
Z-scores divide the curve into regions, allowing probabilities to be calculated.
The body is the larger area; the tail is the smaller area.
Using the Z-table
Gives the proportion (area) corresponding to a particular z-score.
Body = area to the left of a positive z-score.
Tail = 1 - body
Negative z-scores use symmetry of the normal distribution.
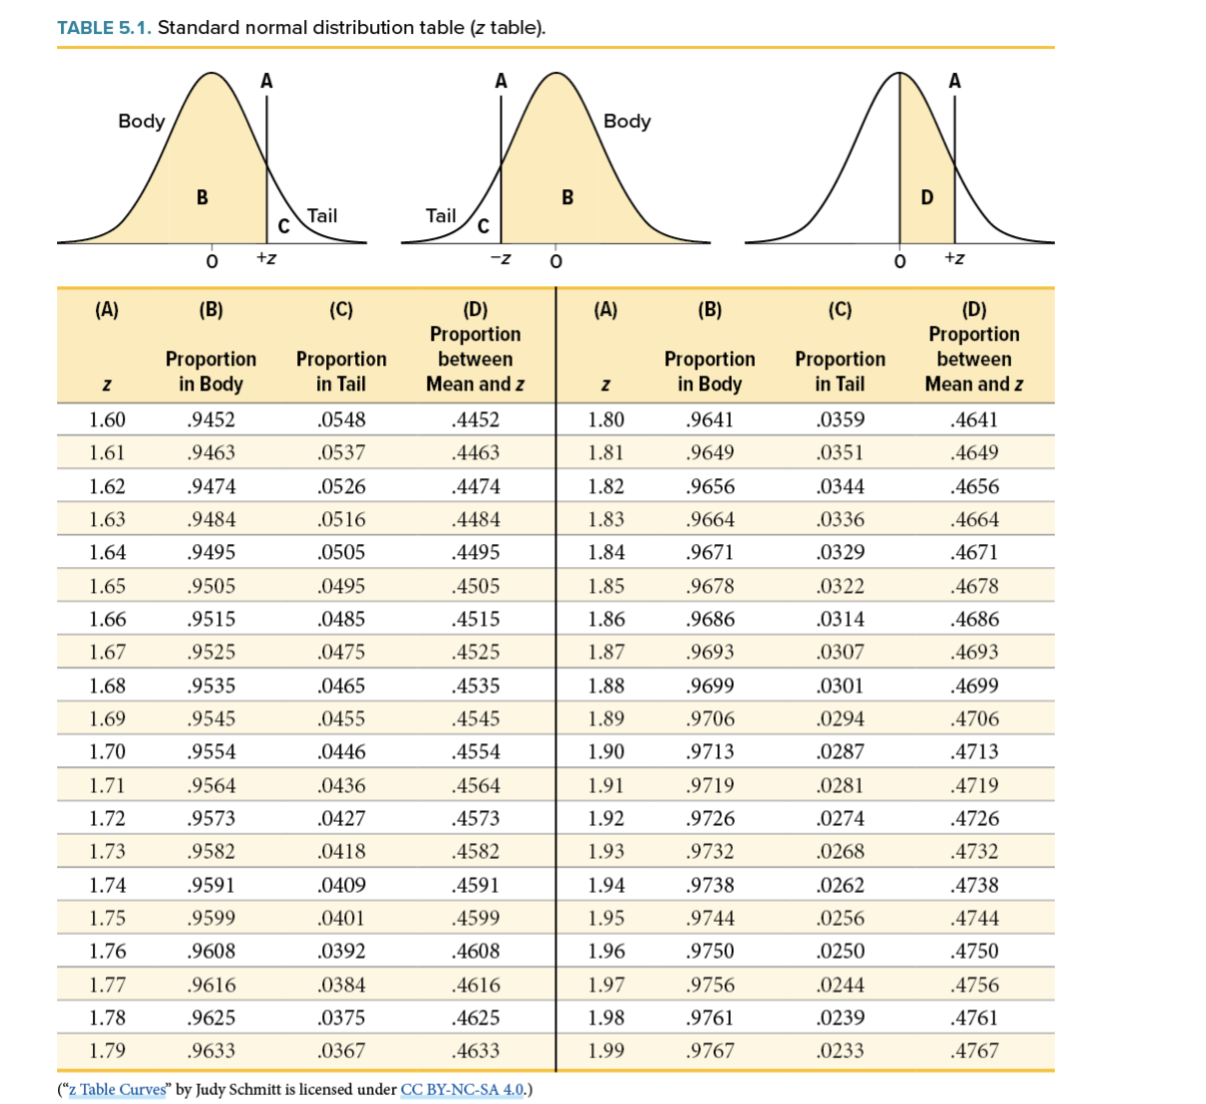
Using the Z-table: example
z = 1.62: Body = 0.9474 (94.74%); Tail = 0.0526 (5.26%).
Beyond z = ±1.96: Each tail = 0.025 (2.5%);
Combined tails = 0.05 (5%).
Between z = 0.50 and z = 1.50:
0.9332 − 0.6915 = 0.2417 (24.17%).