Introduction to Elementary Probability Random Variables and Discrete Probability Distributions
 Call Kai
 Learn
Learn Practice Test
 Spaced Repetition
 Match
Match Flashcards
 Knowt Play
1/12

Earn XP
Description and Tags
Module 4 Lecture 1
Name | Mastery | Learn | Test | Matching | Spaced | Call with Kai | Chat |
|---|
No analytics yet
Send a link to your students to track their progress
13 Terms

Define a random variable. Example?
It is a way of assigning a number to the result of a random experiment. X, represents the uncertain event before it happens.
Example: Roll a die and let X, the random variable, represent the number shown.
Random experiment: Rolling a die
Outcome: Our result was a 4.
Random variable: Therefore, 4 is the value that the random variable takes from that result.

Sample space. Explain how it relates to a random variable. Example.
The sample space, S, is the set of all possible outcomes of a random experiment.
The random variable is a function that turns raw outcomes from the sample space into numbers.
Example:
Random Experiment: Flipping a coin
Sample Space (S): Raw list of all outcomes S = {HH,HT,TH,TT}
Random Variable (X): In this context, we are looking to “count the number of heads”
2,1,1,0 « number of heads
How is the value of a random variable (X) determined from an experiment? Give the two types of setups.
Take a value directly from the outcome.
Roll one die and record the number shown: X=4.
Calculate a value using the outcome.
Roll two dice and add their numbers: X= 2+5 = 7

Explain the difference between an outcome and the value of a random variable in an experiment. Example?
An outcome is the result of the random experiment. The value of a random variable is the number assigned to that outcome, either directly or through a calculation.
Example: Roll two dice.
Outcome: (2,5) — the first die shows 2 and the second shows 5.
Random variable: X = {tells us to sum up the two dice}
Value of the random variable: X=2+5=7 .

Discrete random variable. Example? Importance?
A variable with countable, distinct values that you can list one by one.
Example:
Number of heads in three coin tosses: {0,1,2,3}.
Number shown on a die: {1,2,3,4,5,6}.
Why it matters: It allows us to map out every single possible outcome and assign a clear, individual probability to each one.

Explain the notation P(X=x). Example?
Meaning: The probability (P) that the random variable (X) takes on a specific value (x).
P: probability.
X: random variable.
x: specific value that the random variable could take.
Example: If ‘X’ is the number shown when rolling a die:
P(X=4)= 1/6
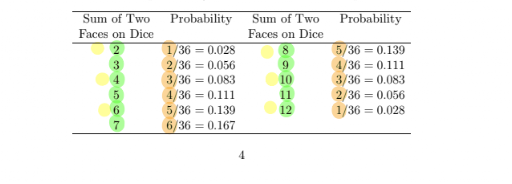
Discrete probability distribution.
a table that lists all possible values of a discrete random variable and their corresponding probabilities.
Basically tells us:
What values the random variable can take.
How likely each value is.
Rules for a Discrete Probability Distribution
1. Bounds: Every individual probability must be between 0 and 1
0 ≤ P( X=x ) ≤ 1
2. Total Sum: All probabilities combined must add up to exactly 1
Σ (X=x) = 1

How is a discrete probability histogram organized, and what key features should you look for to interpret it (2)?
Orientation:
x-axis: All possible random variable values, organized in increasing numerical order.
y-axis / Bar Heights: Represents probability (treated just like relative frequency), where each bar's height equals that specific value's probability.
What to Look For & What It Tells Us:
Peak / Mode: The tallest bar shows the most likely outcome (the mode).
Symmetry & Shape: Look to see if the distribution is balanced or symmetric around a center point, or if it has a specific shape (like being bell-shaped or not).
Why might actual experimental results differ from theoretical probabilities, and how do you fix it? (3)
Sampling Error: Probabilities show long-term trends, not what must happen in every single trial.
Small Sample Size: Too few trials were conducted.
Broken Model Assumptions: Real-world conditions aren't perfectly ideal. (i.e., perfectly fair coin, a symmetrical die, or independent events)
How to fix it: Increase the sample size. As trials increase, observed results get closer to theoretical probabilities (Law of Large Numbers).
What is the formula and meaning of the mean of a discrete random variable, and what two important warnings apply?
Formula:
where, ‘xi’ is the value of the random variable & ‘P(X = xi)’ is its corresponding probability.
Conceptual Meaning
In a large number of independent observations of X, the average value of those observations will be approximately equal to the mean μ.
In this large number of independent trials, the average of the observations will get closer and closer to the actual mean (mu)
Warnings:
This is specifically for probability distributions, meaning it is not the same as the standard raw-data mean.
The expected value of a random variable is the same as its "mean value"

What are the formulas and crucial rules for finding the standard deviation of a discrete random variable?
The 2nd formula is better.
Warnings:
Not Probabilities: Once you find μ and Σ, these are parameters, so they don't have to stay between 0 and 1 or add up to 1..
Square Root Check: The value under the square root must be ≥ 0; never a negative.
Common Trap: Square your mean ( μ2 ) when using the calculating


Why is it important to pay attention to equality symbols (like < vs ≤ ) when translating English phrases into discrete probability notation?
Strict inequalities (< or >) and inclusive inequalities (≤ or ≥) are calculated differently because they include different sets of values.
Example Breakdown (for integers/discrete variables):
X < 5 means strictly less than 5, covering the set {2, 3, 4}.
X ≤ 5 includes 5 as well, covering the set {2, 3, 4, 5}.