Instrumental Analysis Exam 1
 Call Kai
 Learn
Learn Practice Test
 Spaced Repetition
 Match
Match Flashcards
 Knowt Play
1/33

There's no tags or description
Looks like no tags are added yet.
Name | Mastery | Learn | Test | Matching | Spaced | Call with Kai | Chat |
|---|
No analytics yet
Send a link to your students to track their progress
34 Terms
T/F A continuous source provides a constant output of radiation over a wide range of wavelengths.
True
T/F Fluorescence is a type of emission that originates from a triplet source.
False, originates from a singlet source (as opposed to phosphorescence, which emerges from a triplet source).
T/F The wavelength isolation device that has the narrowest bandpass is the filter.
False, a diffraction grating has the narrowest bandpass (highest wavelength resolution).
Filter (broadest) > Prism > Diffraction grating (narrowest)
T/F A bathochromic shift means a shift in wavelength to longer wavelengths (lower energy).
True, also known as a red shift. It is the opposite of a hypsochromic shift (blue shift).
T/F A heterogeneous sample has different compositions in different regions of the sample.
True, as opposed to a homogeneous sample.
T/F Intersystems crossing is an example of radiative process from a singlet to triplet excited state.
False, intersystems crossing is non-radiative (Sn → Tn). It involves a change in electron-spin multiplicity and does not emit a photon.
By contrast:
Fluorescence: radiative, S1 → S0
Phosphorescence: radiative, T1 → S0
T/F Amplification is a signal processing method designed to reduce the signal output.
False, amplification increases signal output.
T/F Samples for fluorescence are typically degassed to remove oxygen.
True, because O2 can quench luminescence, reducing fluorescence intensity.
T/F Corrected spectra allow for data obtained from different instruments to be properly compared.
True
T/F Slits are examples of a type of filter.
False, slits are adjustable openings in a monochromator that limit the amount and spatial spread of light. Filters selectively transmit/reject light based on wavelength through absorption, reflection, or interference.
Phrase Q: A transducer with a built-in amplification system.
Photomultiplier, which utilize a photocathode (photoelectric effect) and (accelerated to) series of dynodes, eventually reaching the anode/detector
Phrase Q: The continuous source used for visible absorption (and near IR) measurements.
Tungsten lamp, which works by resistive heating
Fun fact: Tungsten-halogen lamps allow for operation at a higher filament temperature → higher light intensity (brightness) → use in car headlights
Phrase Q: A wavelength isolation device that reflects light based on Bragg’s Law.
Diffraction grating, whose resolving power increases with the number of illuminated grooves
Bragg’s Law: nλ = d(sin θincident ± sin θreflection)
Resolving power: R = (n = grating order) x (N = # grooves) = W(sin θincident ± sin θreflection) / λ
Phrase Q: A monochromatic source of electromagnetic radiation.
Laser
Phase Q: A filter composed of alternating layers of high and low refractive index materials to eliminate a very narrow wavelength region (i.e., effective transmittance is zero in that region).
Notch filter
Absorption v.s. absorbance
absorption: results from interaction with ions or molecules, energy transfer from photons to atoms/ions/molecules in a substance
absorbance: the quantitative measure of absorption that depends on medium composition and the length of the optical path, given by A (= εbc)
Excitation vs. Emission vs Absorption Spectra
excitation spectrum: luminescence intensity as the excitation wavelength is scanned while the emission wavelength is fixed
emission spectrum: luminescence intensity as the emission wavelength is scanned while the excitation wavelength is fixed
absorption spectrum: absorbance as a function of incident wavelength, shows wavelengths that promote analyte from lower to higheer energy states
Chemiluminescence
A chemical reaction yields an electronically excited species that emits light and returns to the ground state
Reactants → Excited Product → Ground State Product
Given an absorption spectrum, how would you conduct the collection of emission and excitation spectra?
Emission Spectrum: Scan to the red of fixed λex = λmax of absorption (i.e. scan above).
Excitation Spectrum: Fix emission monochromator at λem = λex,max and scan excitation wavelengths across absorption band.
Characterize the components of electromagnetic radiation
Sinusoidal oscillations at right angles to each other and in the direction of propagation.
Plane x: direction of propagation
Plane y: electric field
Plane z: magnetic field
Sampling v.s. sample preparation
sampling: obtain raw sample containing analyte from environment, may be homo- or heterogenous
sample preparation: isolation of analyte from raw sample (purification/concentration) for downstream characterization and experimentation
Lasers as a source of luminescence measurements: Pros and Cons
Pros: high intensity, extremely precise specificity/wavelength
Cons: limited wavelength accessibility
Absorption spectrum collection: photodiode array (advantages) v.s. dual beam absorption spectrophotometer
Faster (collect data points simultaneously), signal averaging, high λ reproducibility
Ensemble averaging
Repetitive measurements or successive data sets over an entire spectral region are collected, summed together point by point, and finally divided by the number of scans
sqrt(# measurements) * S/N
Advantage: The impact of noise decreases, noise is averaged out of a set of datasets
Beer’s Law
A = εbc
Percent transmittance
Fraction of incident light transmitted by the matter
%T = Pin / Pout
A = -log(T) aka T = 10-A
Purpose and operation of a monochromator
Entire dispersing module containing five components that work together to isolate the desired, narrow spectral band (ideally a single wavelength or frequency)
Five components of a monochromator
Entrance slit
Collimator (spread rays in parallel direction)
Wavelength isolator (dispersing)
Focusing element (reform image)
Exit slit
Single beam UV-Vis spectrophotometer box diagram

Fluorescence spectrophotometer box diagram
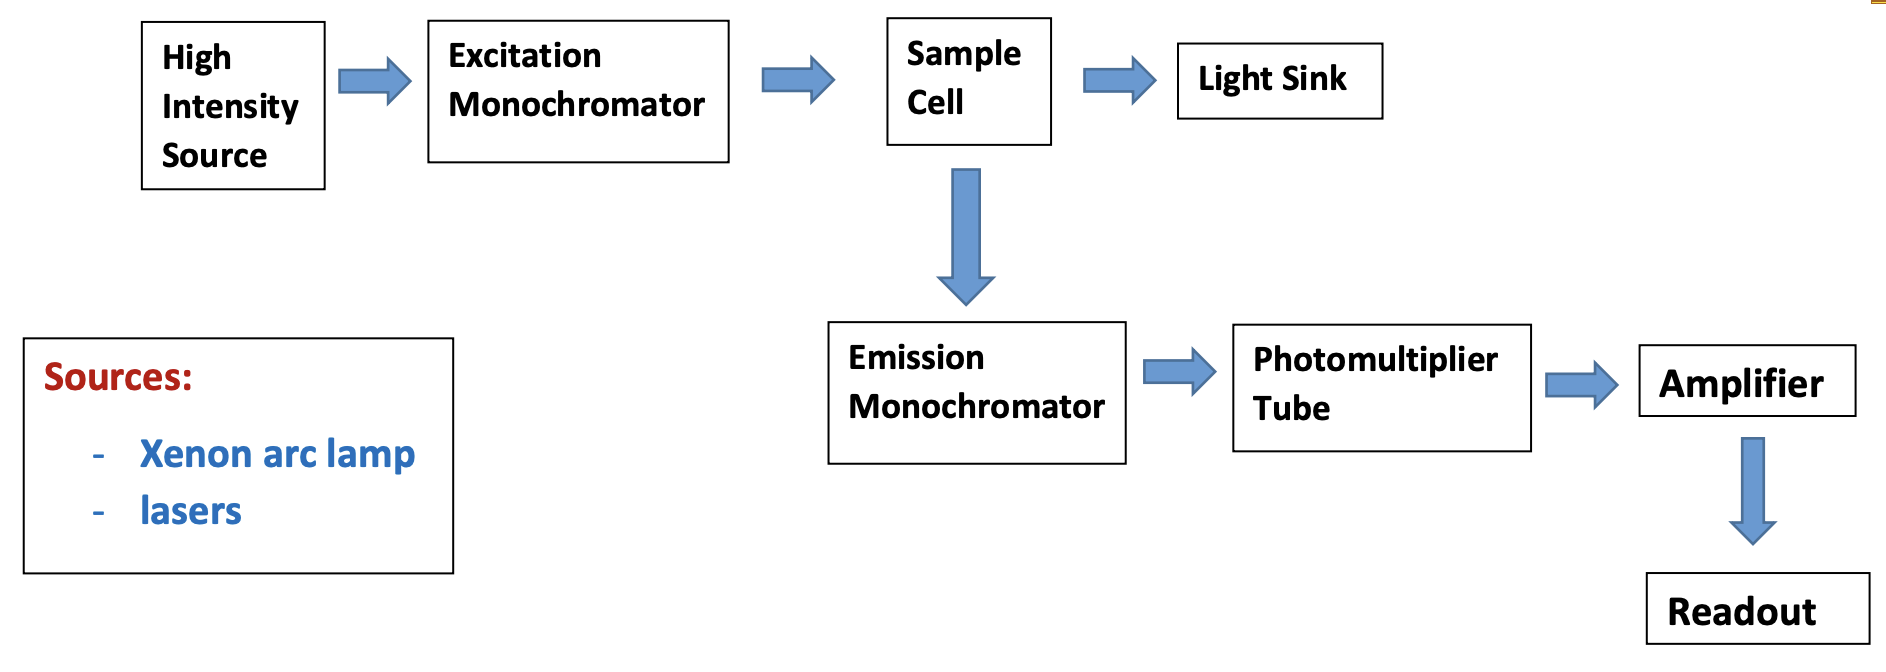
Three major/distinct differences in the instrumental components and setup between UV-Vis v.s. fluorescence spectrophotometers and their significance
in line v.s. 90º detector placement: For fluorescence, keeps it out of the direct path of the high-intensity excitation beam, which reduces contamination
1 v.s. 2 (excitation/emission) monochromators: Luminescence requires either λexcitation or λemission to be held constant.
continuous v.s. high-intensity light source: Luminescence requires sufficiently high-intensity light source to achieve excitation, as opposed to absorption prioritizing coverage of desired spectral region.
Signal
Measurable response produced by a generator that contains information about the identity, properties, or concentration of an analyte, represented by x-bar (mean)
Noise
Random, unwanted fluctuations or variations in an analytical signal, obscuring the true signal, represented by s (standard deviation)
Two major sources of noise found in analytical and instrumental methods
Instrumental
Chemical