L58 - Measures of Disease and Risk in Populations
 Call Kai
 Learn
 Practice Test
 Spaced Repetition
 Match
 Flashcards
 Knowt Play
1/52

There's no tags or description
Looks like no tags are added yet.
53 Terms
Why do we Measure Disease in Populations?
To identify changing disease patterns
Establish baselines
Investigate risk factors
What is the Relationship between an Exposure and an Outcome?
An Exposure is a potential risk factor
An Outcome is the health event being measured
What are the Two Types of Data?
Quantitative Data
EX: Age, weight, flock size
Qualitative Data
Nominative → EX: Live or dead, ill or well (dichotomous), race, breed
Ordinal → EX: Illness score, body condition score
Why must the Numerator and Denominator be Appropriately Matched?
The denominator must include individuals eligible to experience the outcome in the numerator
What is a Ratio?
A comparison of two mutually exclusive frequencies
Expressed as A:B or A/B
What is the Formula for Disease Odds?
Number diseased
÷
Number nondiseased (cases/noncases)

How can a Ratio be Converted into a Proportion?
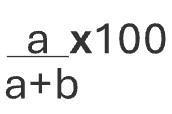
For A:B, calculate A/(A+B)
What is a Proportion?
A fraction in which the numerator is included in the denominator
What is the Formula for a Proportion?
Number of events
÷
Total population

How is a Proportion Converted into a Percentage?
Multiply the proportion by 100
QUESTION 1: What are the odds for ‘heads’ to ‘tails’ when you flip a coin?
→ 1:1
QUESTION 2: What is the probability that you will get ‘heads’ when you flip a coin?
→ 50%
What is a Rate?
A measure of how quickly events occur, incorporating population-time at risk
What is the Formula for an Incidence Rate?
New cases
÷
Total population-time at risk

What is Population-Time at Risk?
The sum of time individuals remain eligible to develop the outcome
How can Population-Time be Estimated?
Count the population midway through the time period
Take the average of the population at the beginning and end of the time period
Take counts at multiple times (e.g. monthly) and average them
QUESTION 3: The number of cats in a shelter was 1000 on Jan 1, 2019, and 1200 on Jan 1, 2020. Which is the most accurate estimate of cat-years at risk?
a.) First day population: 1000 cat yrs
b.) Average: (1000+1200)/2 = 1100 cat yrs
c.) Average of weekly cat counts
d.) Average of monthly cat counts
→ c.) Average of weekly cat counts
What is Crude Mortality?
Deaths from all causes
÷
Total population at risk for death
What is Cause-Specific Mortality?
Deaths from a specific cause
÷
Total population at risk for death
What is Case Fatality?
Deaths from a specific disease
÷
Total cases of that disease
What is Proportionate Mortality?
Deaths from a specific cause
÷
Deaths from all causes
How does Case Fatality differ from Cause-Specific Mortality?
Case fatality uses disease cases as the denominator
Cause-specific mortality uses the population at risk
QUESTION 4: Dr. Johnson found that 38% of sea otter deaths were due to parasitic diseases. What measure of risk was used?
a.) Case-fatality
b.) Proportionate mortality
c.) Crude mortality
d.) Cause-specific mortality
→ b.) Proportionate mortality
Because parasite deaths are divided by all deaths
QUESTION 5: In one year, 30 sea otters die, with 3 of the deaths due to sharkbite, out of a total sea otter population of 3000. What is the crude mortality?
a.) <1%
b.) 1%
c.) 10%
d.) 100%
→ 1%
30/3,000 × 100 = 1%
All causes of death are included.
What is Prevalence?
A snapshot of all existing cases at a particular point in time

What is the Formula for Point Prevalence?
Existing cases at a point in time
÷
Total population at that time
What is Incidence?
The occurrence of new cases during a defined period
What are the Two Main Types of Incidence?
Cumulative incidence (CI)
Incidence density rate (IDR)
What is the Formula for Cumulative Incidence?
New cases during a period
÷
Population initially at risk
What is the Formula for Incidence Density Rate?
New cases
÷
Total animal-time at risk
How does Prevalence differ from Incidence?
Prevalence measures existing cases
Incidence measures new cases over time

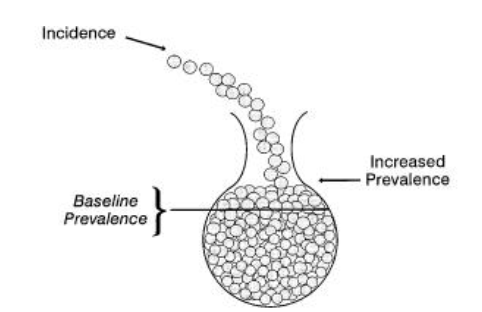
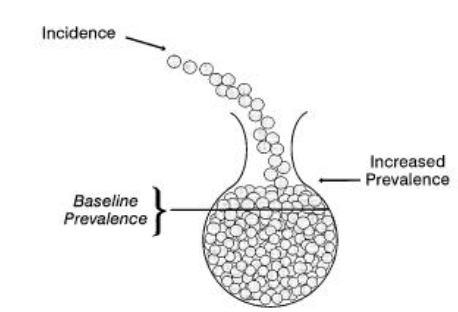
What is the Water Glass Analogy for Prevalence and Incidence?
Water present = Prevalence
Water entering = Incidence
Water leaving = recovery or removal

What Factors can Increase or Decrease Prevalence?
New cases increase it
Recovery
Death
Removal of cases

QUESTION 6: How could we go about measuring only incident (new) cases of diarrheal disease from Salmonella in the gorilla population?
Identify baseline cases, then monitor initially unaffected gorillas for new cases.

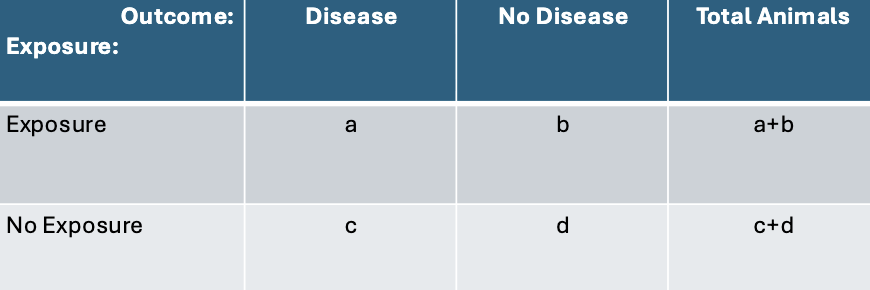
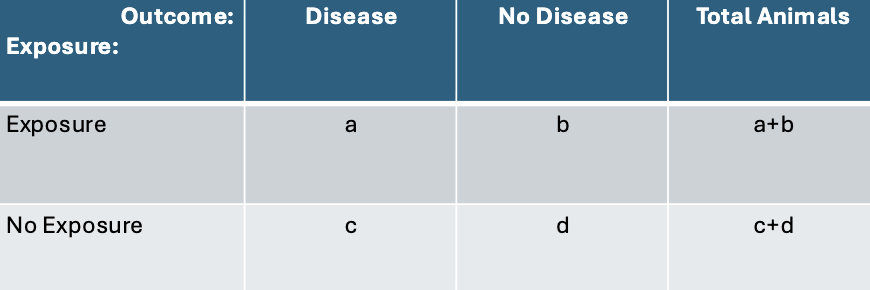
What is the Purpose of a 2 × 2 Epidemiological Table?
To classify individuals by exposure and disease status and compare disease risk

What do A, B, C, and D Represent in a 2 × 2 Table?
A: Exposed/case
B: Exposed/noncase
C: Unexposed/case
D: Unexposed/noncase
What is the Formula for Risk in the Exposed Group?
A/(A+B)

What is the Formula for Risk in the Unexposed Group?
C/(C+D)

What is the Formula for Risk Ratio (RR)?
RR = [A/(A+B)] ÷ [C/(C+D)]

How are Risk Ratio Values Interpreted?
RR = 1: Equal risk
RR > 1: Higher exposed risk
RR < 1: Lower exposed risk
What is the Formula for Attributable Risk (Risk Difference)?
AR = [A/(A+B)] − [C/(C+D)]


What is the Risk Ratio for Young vs. Old Gorillas?
(30/100) ÷ (80/600) ≈ 2.3

QUESTION 7: What does this risk ratio of 2.3 mean?
a.) Old animals were 2.3 times as likely to get respiratory disease compared to old animals
b.) Young animals were 2.3 times as likely to get respiratory disease compared to old animals
→ a.) Old animals were 2.3 times as likely to get respiratory disease compared to old animals
QUESTION 8: What is the attributable risk due to being young?
a.) Inc.(young) - Inc.(old) = 0.3 -0.13 =0.17
b.) Inc.(old) - Inc.(young) = 0.13 -0.3 = -0.17
c.) Inc.(old) / Inc.(young) = 0.13/0.3 = 0.43 = 43%
d.) c.) Inc.(yound) / Inc.(old) = 0.3/0.13 = 2.31 = 231%
→ a.) Inc.(young) - Inc.(old) = 0.3 -0.13 =0.17

Ratio vs. Proportion vs. Rate SUMMARY
Measurement | Definition | Formula | Key Difference |
Ratio | Compares two mutually exclusive groups | A/B | Numerator is NOT included in denominator |
Proportion | Compares a subset to the total | A/(A+B) | Numerator IS included in denominator |
Rate | Measures how quickly events occur over time | Events / Population-time at risk |
Examples:
Ratio: 4 female students : 1 male student = 4:1
Proportion: 3 diseased animals / 15 total animals = 20%
Rate: 10 new disease cases / 100 animal-years = 0.10 cases per animal-year
Remember:
Ratio = Comparison
Proportion = Part of whole
Rate = Speed of occurrence
Four Mortality Measurements SUMMARY
Measurement | Numerator | Denominator | What It Tells You |
Crude Mortality | All deaths | Total population at risk | Overall mortality |
Cause-Specific Mortality | Deaths from disease X | Total population at risk | Mortality due to disease X |
Case Fatality | Deaths from disease X | Total cases of disease X | How often disease X is fatal |
Proportionate Mortality | Deaths from disease X | All deaths | Percentage of deaths due to disease X |
How to Recognize Each Mortality Measurement on an Exam SUMMARY
Question | Measurement |
How many animals died from ANY cause? | Crude mortality |
How many animals in the population died from disease X? | Cause-specific mortality |
Of the animals WITH disease X, how many died? | Case fatality |
Of ALL deaths, how many were caused by disease X? | Proportionate |
Prevalence vs. Incidence SUMMARY
Feature | Prevalence | Incidence |
Measures | Existing cases | New cases |
Time | Point in time | Defined time period |
Includes | Old + new cases present | Only new cases |
Main Question | How much disease exists? | How frequently does new disease occur? |
Formula | Existing cases / Total population | New cases / Population at risk or animal-time |
Purpose | Measures disease burden | Measures occurrence of new disease |
Analogy | Photograph | Video |
Remember:
Prevalence = Being a case
Incidence = Becoming a case
Two Types of Incidence SUMMARY
Feature | Cumulative Incidence (CI) | Incidence Density Rate (IDR) |
Measures | Risk of becoming a new case | Rate of developing new cases |
Numerator | New cases | New cases |
Denominator | Population initially at risk | Total animal-time at risk |
Formula | New cases / Population at risk | New cases / Animal-time |
Units | Proportion or % over a period | Cases per animal-day, month, or year |
Interpretation | Probability of developing disease | Speed of new case occurrence |
Important: Cumulative incidence uses the number of individuals at risk, while incidence density uses their total time at risk
The 2 × 2 Epidemiological Table
Exposure Status | Disease + | Disease − | Total |
Exposed | A | B | A+B |
Unexposed | C | D | C+D |
Calculation | Formula |
Risk in Exposed | A/(A+B) |
Risk in Unexposed | C/(C+D) |
Risk Ratio (RR) | [A/(A+B)] / [C/(C+D)] |
Attributable Risk (AR) | [A/(A+B)] − [C/(C+D)] |
Remember: Calculate the risk in each group FIRST, then divide for risk ratio or subtract for attributable risk.
Risk Ratio vs. Attributable Risk SUMMARY
Feature | Risk Ratio (RR) | Attributable Risk / Risk Difference (AR) |
Measures | Relative difference in risk | Absolute difference in risk |
Operation | Division | Subtraction |
Formula | Exposed risk / Unexposed risk | Exposed risk − Unexposed risk |
Reference Value | 1 = equal risk | 0 = no difference |
Interpretation | How many times the risk? | How much additional risk? |
Risk Ratio Interpretation SUMMARY
RR Value | Meaning |
RR = 1 | Equal risk in exposed and unexposed |
RR > 1 | Greater risk in exposed |
RR < 1 | Lower risk in exposed |
Gorilla Respiratory Disease Practice Example SUMMARY
Measurement | Young Gorillas (Exposed) | Old Gorillas (Unexposed) |
New cases | 30 | 80 |
Population at risk | 100 | 600 |
Measurement | Young Gorillas (Exposed) | Old Gorillas (Unexposed) |
New cases | 30 | 80 |
Population at risk | 100 | 600 |
Risk | 30/100 = 0.30 | 80/600 ≈ 0.13 |
Percentage | 30% | 13% |
Risk Ratio:

Interpretation: Young gorillas had approximately 2.3 times the risk of respiratory disease compared with old gorillas.
Attributable Risk:

Interpretation: Young gorillas had approximately 17 additional cases per 100 gorillas at risk compared with old gorillas during the year