STAT113 - Exam 1
 Call Kai
 Learn
Learn Practice Test
 Spaced Repetition
 Match
Match Flashcards
 Knowt Play
1/80

There's no tags or description
Looks like no tags are added yet.
Name | Mastery | Learn | Test | Matching | Spaced | Call with Kai | Chat |
|---|
No analytics yet
Send a link to your students to track their progress
81 Terms
Histogram
A graph that displays a frequency distribution or a relative frequency distribution
Frequency distribution (of a set of observations)
A specification of the classes (or categories, or events) into which observations are sorted, along with the number of observations in each of the classes
Frequency
Number of times the value, category, or event occurs
3 types of frequency
Cumulative, relative, cumulative relative
Cumulative frequency
Sum of the frequencies belonging to the value and the ones below it
Relative frequency
Frequency expressed as a proportion of all observations
Frequency/total # of observations
Cumulative relative frequencies
Sum of the relative frequencies and the ones below it
How to make a histogram
Break up the range of data values into classes and count number of observations that fall into each class
Initial class boundary = left endpoint of the first class
Class width = width of the interval defining the class
Classes are displayed on the horizontal axis, while class frequencies are displayed on the vertical axis.
Peak
Bar or small group of bars that, relative to the bars nearby, is a clear and prominent high point of the histogram
Unimodal
Has one peak
Bimodal
Has two peaks
Symmetric
Left half is a mirror image of the right half
Uniform
All bars are the same height
Bell shaped
Looks like bell, unimodal and symmetric
Tail
Has a tail if one side of the histogram bars tend to get shorter and shorter the farther they are from the peak
Skewed to the left/negatively skewed
Has a long tail that extends left
← Peak
Skewed to the right/positively skewed
Has a long tail that extends to the right
Peak →
Quantitative variable
Values are numbers representing amounts
Ex. temperature, birth year
Categorical (or qualitative) variables
One whose values are categories, or “kind” or “type”
Ex. US state of current residence, eye color
Nominal categorical
No natural ranking or ordering
Ordinal categorical
DOES have natural ranking or ordering
Interval level
Quantitative data
Differences between values are meaningful, no meaningful 0 value
Ratio level
Quantitative data
Differences between values are meaningful, 0 has a meaningful value
Population
The collection of all objects under study
Parameter
A measurement obtained from every object of a population, characteristic of a population
Sample
Smaller collection of objects from the population
Statistic
A measurement obtained from a sample, usually given as a number
What is the key difference between a parameter and a statistic?
A statistic is always knowable, while a parameter may be impractical or impossible to know
Discrete variables
Quantitative data
One whose possible values can be counted, meaning that its possible values correspond to some subset of the whole numbers
Often arise when the quantities are being counted (“The number of…”)
Continuous variable
Quantitative data
One whose values make up an interval of real numbers, could take any value in a range of numbers
Often arise when the quantities are being measured
Random sample
A sample of predetermined size is chosen from the population, care is taken in such a way that every sample of that size is equally likely to be selected
Systematic sample
The members of a population are listed in some order, then every (x)th member is selected for the sample until a predetermined sample is reached
Stratified sample
Population divided into groups, with each group made up of members that share some particular characteristics, e.g. an occupation, then a fixed number of members (not all members) from each group are randomly selected for the sample
Cluster sample
Population is divided into groups that tend to exist naturally, then all members of some randomly chosen groups (but not all groups) are selected for the sample
Convenience sample
Members of the population that are easily accessible are selected for the sample
Experimental units
The people, objects, or other entities being measured
Response variable/dependent variable
The aspect being measured for each experimental unit
Explanatory variable/independent variable
The variable that is manipulated by the researcher
Observational studies
The researcher simply observes what is currently happening, or what has happened in the past, and uses the observations to try and make conclusions, does not actively impose treatments on the experimental units
Prospective study
Type of observational study
Participants are identified in advance, and data are collected over time as events unfold
An observational study cannot be both prospective and retrospective.
Retrospective study
Type of observational study
The data are collected after the outcome has occurred, using records obtained from the past
An observational study cannot be both prospective and retrospective.
Designed experiments
The researcher manipulates conditions to try to determine the effect of the conditions on the response variable, researcher randomly assigns experimental units to treatments
Double-blind experiment
Type of designed experiment
Neither the person interacting with the participants nor the participants know which participants have been assigned to which treatment
A designed experiment can be both double-blind and completely randomized.
Completely randomized experiment
Type of designed experiment
Participants are randomly assigned to groups, and then the groups are randomly assigned to receive treatments
A designed experiment can be both double-blind and completely randomized.
What are the two reasons that an observational study would be done instead of a randomized experiment?
It may be unethical to assign participants to treatments they are opposed to, or that may harm them
Researcher may not have control over the treatments
Confounder
A variable whose effect on the outcome cannot be distinguished from the effect of the on the outcome from different treatments
What are the two methods to eliminate confounders?
Blocking, = participants who are known to be similar in some way are grouped together
Matched pairs
Sampling bias
When the researcher chooses a sample in such a way that certain members are more likely to be included than others
This can be avoided by taking a random sample.
Voluntary response bias
When the members of the sample of the population voluntarily choose to participate.
Bias comes from the tendency for volunteers to not be representative of the whole population.
Researcher does not choose the sample.
Response bias
The way that the study is conducted causes the members of the sample to give inaccurate or untruthful responses.
Can be reduced by allowing respondents to answer anonymously and wording questions with a clear and neutral response
Nonresponse bias
When a study has many people that do not respond
Can be reduced by offering an incentive to respond or sending reminders to those who have not yet responded
Is standard deviation of a population different than standard deviation of a sample?
Yes.
Standard deviation of a population
The measure of the “spread” of the measurements of the population about their mean.
The more that measurements tend to differ (deviate) from their mean, the greater the standard deviation.
How to find standard deviation of a population
Find their mean.
Compute the average of their squared deviations from the mean: (x-mean)² + (x-mean)² etc. / # of observations
This gives the population variance, which is standard deviation squared, so you must take the square root of the number calculated
How to find standard deviation of a sample
Find the mean.
Compute the average of their squared deviations from the mean: (x-mean)² + (x-mean)² / # of observations - 1
Take the square root of number found.
Mean
The sum of the measurements in a data set/number of measurements in the data set
Median
The “middle” value when the data have been ordered
Mode
The measurement (or measurements) that appear with the highest frequency
mu (μ)
Represents the mean of a population
sigma (σ)
Standard deviation of a population
sigma (σ) squared
Variance of a population
x with a bar over it
Mean of a sample
s
Standard deviation of a sample
s squared
Variance of a sample
How to approximate the mean of a data set given a frequency distribution
Find the midpoint of each class - add the class limits (smallest and largest numbers of each class) and divide them by 2
Multiply each classes frequency by the midpoint
Add up all those products
Divide by the size of the data set
How to approximate the mean of a data set given a histogram
Estimated mean = + (frequency/sum of frequencies) * (midpoint) +/total number of frequencies
Range
The difference between the largest and smallest values
Five-number summary
Minimum
Lower quartile
Median
Upper quartile
Maximum
Interquartile range (IQR)
Upper quartile - lower quartile
How to find lower quartile of a data set
Multiply number of data values * 0.25
Round up to nearest integer
That is the number in the ordered data set that is the lower quartile
How to find upper quartile of data set
Multiply number of data values * 0.75
Round up to nearest integer
That is the number in the ordered data set that is the lower quartile
When is the median the better measure for a data set?
When the data set has outliers.
When is the mean the better measure for a data set?
When the data set doesn’t have outliers.
When is the mode the better measure for data set?
When categorical data is being used.
What does small range indicate about a data set?
Low variability in data.
What does a large range indicate about a data set?
High variability in data.
What does small mean indicate about a data set?
The values in the data set are low on average.
What does large mean indicate about a data set?
The values in a data set are high on average.
Box-and-whisker plots
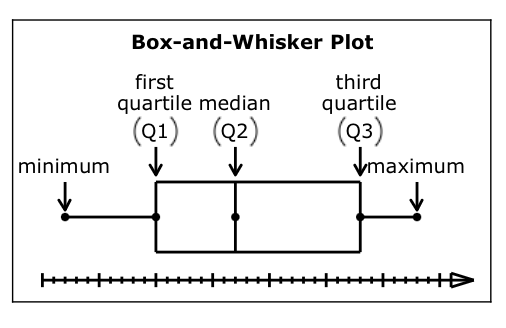
Using IQR to find outliers in a data set
Calculate upper and lower quartile.
Find IQR.
For lower boundary, subtract 1.5*IQR from the lower quartile. For the upper boundary, add 1.5*IQR to the upper quartile.
Whatever number in the data set are above or below these numbers are outliers.
Approximating the standard deviation of a data set given a histogram
Find weighted mean, = (+ (frequency/total number of observations)*(midpoint) +)/size of data set
(+ frequency*(midpoint-estimated mean)²)/(size of data set - 1)