Week 3: Tsunamis
0.0(0)
Studied by 0 people Call Kai
 Learn
Learn Practice Test
 Spaced Repetition
 Match
Match Flashcards
 Knowt Play
Card Sorting
1/47

Earn XP
Description and Tags
Last updated 12:10 PM on 10/11/26
Name | Mastery | Learn | Test | Matching | Spaced | Call with Kai | Chat |
|---|
No analytics yet
Send a link to your students to track their progress
48 Terms
1
New cards
Tsunami is Japanese for ____ ____
Harbour wave
2
New cards
Tsunamis are produced by ___________________
the sudden displacement of water
3
New cards
Events capable of triggering tsunamis:
* earthquakes that cause uplift of the seafloor
* landslides
* volcano flank collapse
* underwater volcanic eruptions
* meteorites
* landslides
* volcano flank collapse
* underwater volcanic eruptions
* meteorites
4
New cards
Historic tsunamis
**Cause: Lisbon Earthquake, Portugal**
* (M 9.0)
* 1755
* casualties: 20,000
\
**Cause: Krakatoa Volcanic Eruption**
* 1883
* casualties: 36,000
\
**Cause: Sumatra Earthquake, Indonesia**
* (M 9.1)
* 2004
* casualties: 230,000
\
**Cause: Tohoku Earthquake**
* (M 9.0)
* 2011
* casualties: 16,000
* (M 9.0)
* 1755
* casualties: 20,000
\
**Cause: Krakatoa Volcanic Eruption**
* 1883
* casualties: 36,000
\
**Cause: Sumatra Earthquake, Indonesia**
* (M 9.1)
* 2004
* casualties: 230,000
\
**Cause: Tohoku Earthquake**
* (M 9.0)
* 2011
* casualties: 16,000
5
New cards
Earthquakes can cause tsunamis in 2 ways:
1. Displacement of the seafloor
2. By triggering a landslide that enters water
6
New cards
Generally an earthquake must be of at least Magnitude: __ to trigger a tsunami
7\.5
7
New cards
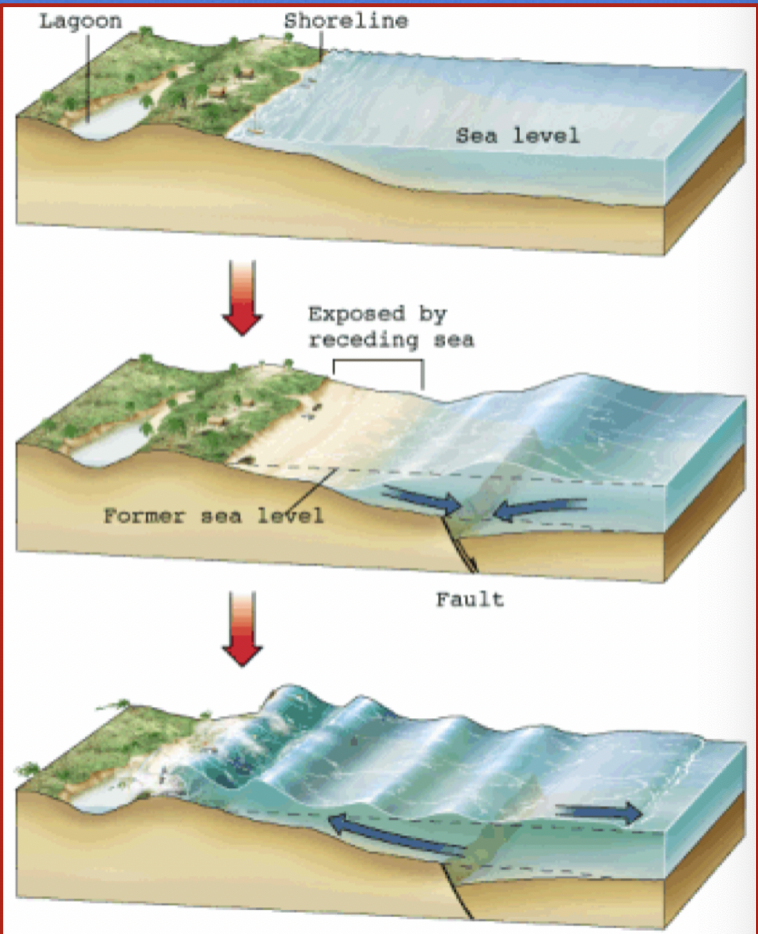
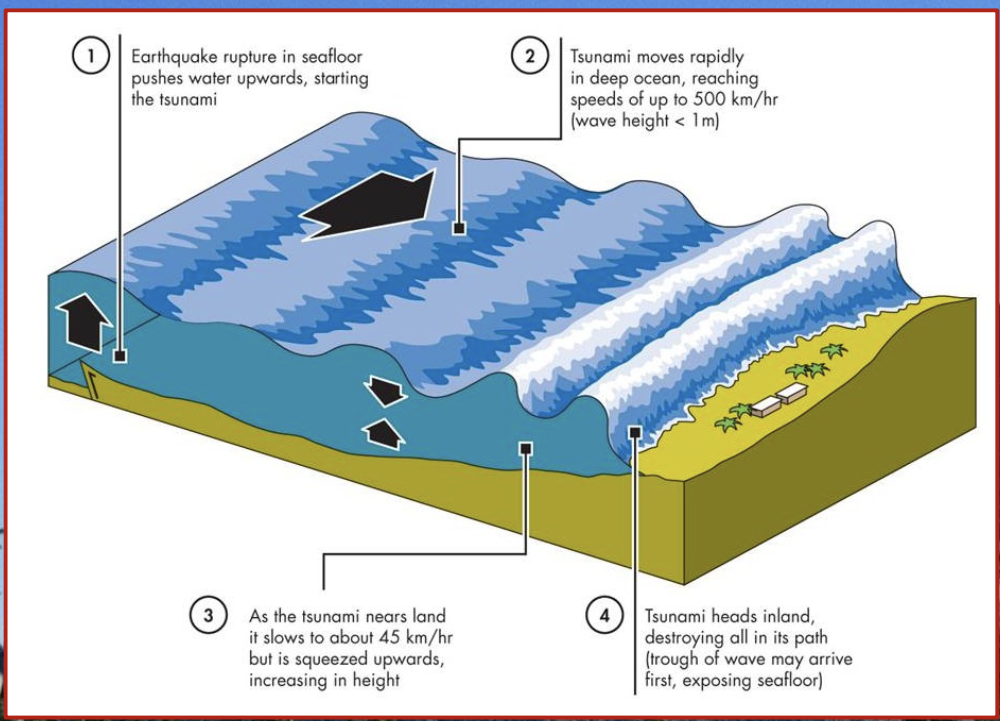
Tsunamis develop in a 4-stage process
8
New cards
Tsunamis Stage 1:
Displacement of the seafloor sets waves in motion that transmit energy upward and outward
* when the waves reach the surface of the water, they spread outward
* when the waves reach the surface of the water, they spread outward
9
New cards
Stage 2:
The waves move rapidly across the open ocean
* they can reach speeds of over 500km/h
\
The spacing of the wave crests is very large (it can be more than 100km)
\
The height (amplitude) of the waves is often small
(less than 1 m)
\
\*Passengers on ships in the ocean rarely even notice tsunamis passing underneath them
* they can reach speeds of over 500km/h
\
The spacing of the wave crests is very large (it can be more than 100km)
\
The height (amplitude) of the waves is often small
(less than 1 m)
\
\*Passengers on ships in the ocean rarely even notice tsunamis passing underneath them
10
New cards
Stage 3:
As the tsunami approaches land, the water depth decreases
\
This results in the water ‘piling up’ and causes these effects:
* **a decrease in wave speed**
* **a decrease in spacing of the waves**
* **an increase in wave amplitude**
\
This results in the water ‘piling up’ and causes these effects:
* **a decrease in wave speed**
* **a decrease in spacing of the waves**
* **an increase in wave amplitude**
11
New cards
Stage 4:
As the tsunami impacts land, waves can reach heights of dozens of meters
\
The wave speed at this time can be up to 50km/h making them impossible to outrun
\
During some Tsunamis, the water first recedes from the shore and exposes the seafloor
\
The wave speed at this time can be up to 50km/h making them impossible to outrun
\
During some Tsunamis, the water first recedes from the shore and exposes the seafloor
12
New cards
Diagram summary of the stages:
13
New cards
Tsunami Event
A tsunami event consists of a series of large waves reaching shore, that can last for several hours
14
New cards
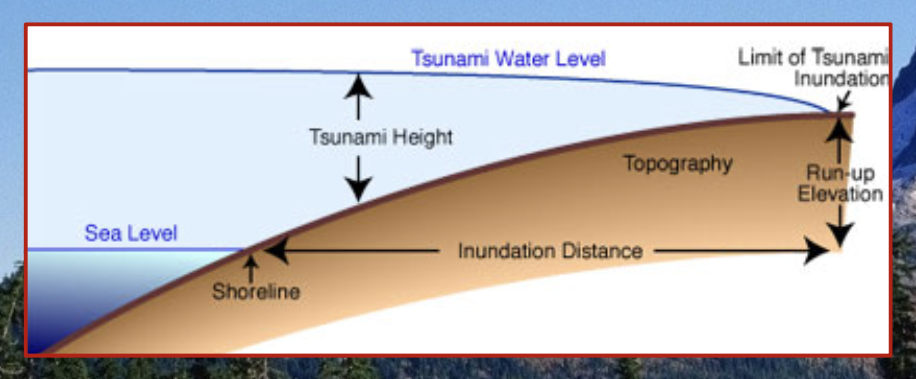
**Run up**
The maximum distance that the largest wave of a tsunami reaches as it travels inland
15
New cards
Distant Tsunami
A tsunami that travels thousands of kilometres across the open ocean.
On remote shorelines across the ocean, reduced energy lessens its impact.
* also called tele-tsunamis
On remote shorelines across the ocean, reduced energy lessens its impact.
* also called tele-tsunamis
16
New cards
Regional Tsunami
A tsunami that affects shorelines 100km to 1000km from its source
17
New cards
local tsunami
A tsunami that affects shorelines within 100km of its source
* most dangerous
* eg. Japan
* most dangerous
* eg. Japan
18
New cards
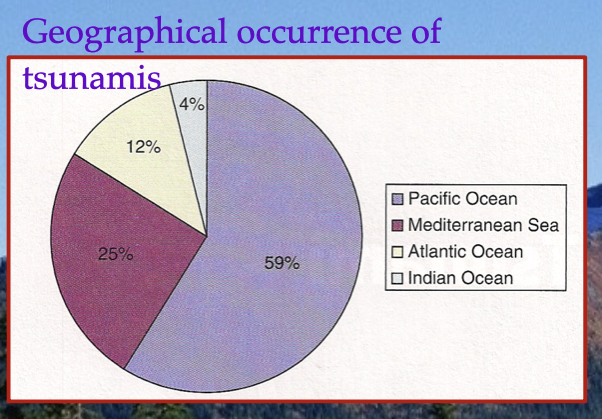
Regions at risk
\
which oceans are at most risk?
\
which oceans are at most risk?
Coasts located near subduction zones or across oceans from subduction zones are most at risk.
\
Areas at greatest risk are the Pacific Ocean and the Mediterranean Sea.
\
Areas at greatest risk are the Pacific Ocean and the Mediterranean Sea.
19
New cards
Primary effects
* flooding and erosion → destroy beaches, coastal vegetation and infrastructure
\
After the tsunami retreats to the ocean, scattered debris is left behind
\
Most tsunami deaths are from drowning, injuries results from physical impacts from debris
* crushed
\
After the tsunami retreats to the ocean, scattered debris is left behind
\
Most tsunami deaths are from drowning, injuries results from physical impacts from debris
* crushed
20
New cards
Secondary effects:
These are effects that generally occur after the event is over
\
* Fires may develop due to ruptured gas lines or from ignition of flammable chemicals
* water supplies become contaminated and water- bourne diseases (cholera) may spread
\
* Fires may develop due to ruptured gas lines or from ignition of flammable chemicals
* water supplies become contaminated and water- bourne diseases (cholera) may spread
21
New cards
Indian Ocean Tsunami of 2004
This catastrophic event occurred on Dec. 26th.
* The source was a __**M 9.1**__ earthquake of the west coast of Sumatra
* (an Island in Indonesia)
* __**3rd Strongest earthquake in world history**__
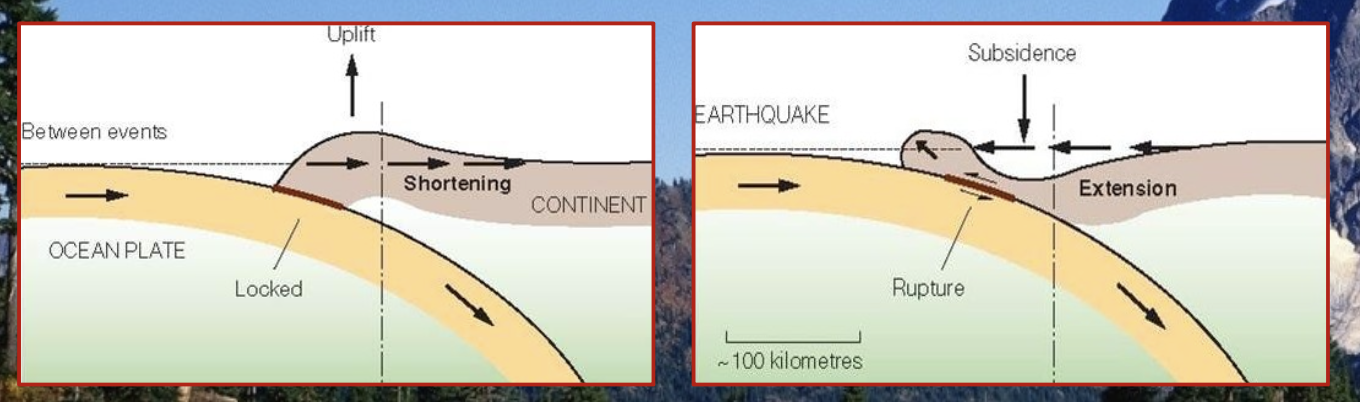
* The earthquake occurred in a __**Subduction zone**__
* These plates had been locked for over 150 years, thus allowing strain to build
* the rupture caused some land areas along the coastline to subside below sea level
* The Tsunami reached nearby Indonesian islands within minutes of the earthquake
* Many costal communities in Indonesia and surrounding countries were heavily damaged by the event
* Countries bordering the Indian Ocean did not have a tsunami warning system like those bordering the Pacific Ocean
* People were caught by surprise and over 23,000 died
* Many were unfamiliar with Tsunamis
* some were even intrigued by approaching waves
* Most people were ignorant of an early warning sign
* the receding sea
* The source was a __**M 9.1**__ earthquake of the west coast of Sumatra
* (an Island in Indonesia)
* __**3rd Strongest earthquake in world history**__
* The earthquake occurred in a __**Subduction zone**__
* These plates had been locked for over 150 years, thus allowing strain to build
* the rupture caused some land areas along the coastline to subside below sea level
* The Tsunami reached nearby Indonesian islands within minutes of the earthquake
* Many costal communities in Indonesia and surrounding countries were heavily damaged by the event
* Countries bordering the Indian Ocean did not have a tsunami warning system like those bordering the Pacific Ocean
* People were caught by surprise and over 23,000 died
* Many were unfamiliar with Tsunamis
* some were even intrigued by approaching waves
* Most people were ignorant of an early warning sign
* the receding sea
22
New cards
Lessons from the 2004 Tsunami
Effective tsunami warning systems are needed around all oceans where tsunamis can occur
\
In 2006, a new warning system became operational in the Indian Ocean
\
In 2006, a new warning system became operational in the Indian Ocean
23
New cards
Why isn’t a warning system enough by itself?
* emergency officials must have an organized plan for evacuating residents during a warning
* earthquake and tsunami education is necessary for people who live along or visit coastlines
* earthquake and tsunami education is necessary for people who live along or visit coastlines
24
New cards
Detecting tsunamis
The Pacific Ocean warning system uses a network of **seismograph**s to estimate earthquake magnitude.
* sensors are electronically connected to buoys verify that a tsunami was produced
* These sensors are called __***tsunameters***__
\
\
They rest on the seafloor and measure changes in water pressure passing over them.
* sensors are electronically connected to buoys verify that a tsunami was produced
* These sensors are called __***tsunameters***__
\
\
They rest on the seafloor and measure changes in water pressure passing over them.
25
New cards
Structural control
Damage can be minimized through regulations on buildings and structures.
\
Some cities in Hawaii require flood proofing measures such as basement window sealing and bolting homes to their foundation.
\
* Concrete levees are other preventative measures but can be very expensive
* Offshore barriers are only feasible outside cities with very large populations.
\
Some cities in Hawaii require flood proofing measures such as basement window sealing and bolting homes to their foundation.
\
* Concrete levees are other preventative measures but can be very expensive
* Offshore barriers are only feasible outside cities with very large populations.
26
New cards
Inundation Maps
Maps showing the geographic area that can be potentially impacted by tsunamis are created to help plan for future events.
\
Historical records, geologic data, and aerial photography aid in making the maps.
\
Many North American cities on the Pacific coast have such maps and development restrictions may exist there in areas at high risk of tsunamis
\
Historical records, geologic data, and aerial photography aid in making the maps.
\
Many North American cities on the Pacific coast have such maps and development restrictions may exist there in areas at high risk of tsunamis
27
New cards
Land use
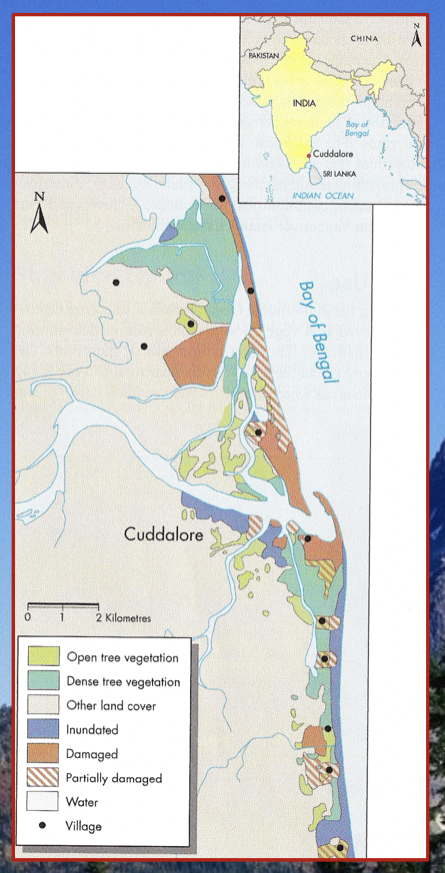
Vegetation plays a role in determining tsunami damage
eg.
* the Mangroves in India
* pictured in green
\
In areas impacted by smaller waves, trees and dense vegetation can protect the land
\
eg.
* the Mangroves in India
* pictured in green
\
In areas impacted by smaller waves, trees and dense vegetation can protect the land
\
28
New cards
Japan Tsunami of 2011
This catastrophic event occurred on March 11th
* M 9.0
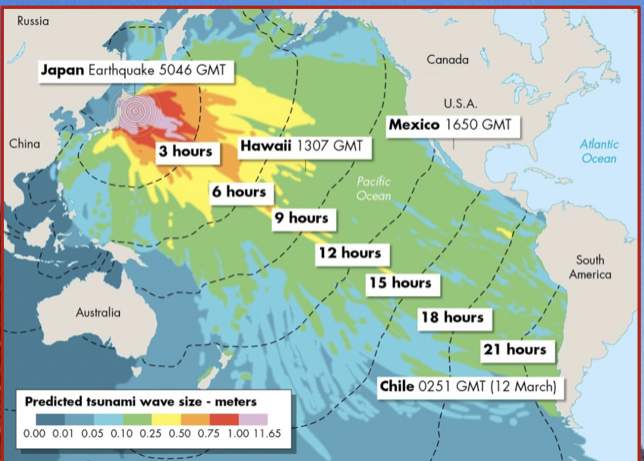
* 70km off the east coast of Japan - Local event
* A tsunami warning was issued nearly an hour before its arrival
* was a tele tsunami for California, Hawaii etc. (see image)
* Over 15,000 people died and damage to Japan’s infrastructure was extensive.
* M 9.0
* 70km off the east coast of Japan - Local event
* A tsunami warning was issued nearly an hour before its arrival
* was a tele tsunami for California, Hawaii etc. (see image)
* Over 15,000 people died and damage to Japan’s infrastructure was extensive.
29
New cards
Categories of Adjustment
* Modify the loss burden
* Modify design
* modify human vulnerability
* Modify design
* modify human vulnerability
30
New cards
Modify the loss burden
* loss sharing
* spread the burden well beyond immediate victims
\
examples:
* insurance
* relief aid
* spread the burden well beyond immediate victims
\
examples:
* insurance
* relief aid
31
New cards
Modify design
* loss reduction
* requires a knowledge base of the hazard
\
Example:
* retrofitting buildings
* diagonal beams added to old buildings for better protections
* seismic upgrade
\
* requires a knowledge base of the hazard
\
Example:
* retrofitting buildings
* diagonal beams added to old buildings for better protections
* seismic upgrade
\
32
New cards
Modify human Vulnerability
* adjust the population to prepare to the possible events
\
example:
* preparedness programs
* land use planning
* warning systems
\
example:
* preparedness programs
* land use planning
* warning systems
33
New cards
Factors affecting adjustment choices
Hazards are not typically a priority of governments (compared to unemployment, inflation, health care, crime, poverty, etc.)
\
Radical vulnerability adjustments are unrealistic (e.g., moving entire communities).
* a cost benefit assessment is typically required
\
Radical vulnerability adjustments are unrealistic (e.g., moving entire communities).
* a cost benefit assessment is typically required
34
New cards
Losses 1: Accepting loss
1. Accepting loss
\
This is the ‘free’ choice. It is a no-action response
\
People choose to live how they want regardless of the hazard risk, **but aid may not be provided** after a disaster
\
**example:**
* floodplain housing can be attractive because it may be inexpensive
35
New cards
Losses 2: sharing loss
2. Sharing loss
\
This is the government-action response.
\
There may be laws in place preventing people from living in certain areas.
\
If governments do not intervene after a disaster, there are often political ramifications
36
New cards
Sharing loss
Aid can come from external sources (UNICEF), internal sources (government), inter-community sources (local), and insurance.
\
**Problems with Sharing Loss:**
* a disaster of sudden onset is likely to draw more money than another similarly serious disaster
* **donor fatigue** can set in if there are many disasters
* recovery can take a very long time in some countries
* aid enthusiasm to donate eventually wanes
\
**Problems with Sharing Loss:**
* a disaster of sudden onset is likely to draw more money than another similarly serious disaster
* **donor fatigue** can set in if there are many disasters
* recovery can take a very long time in some countries
* aid enthusiasm to donate eventually wanes
37
New cards
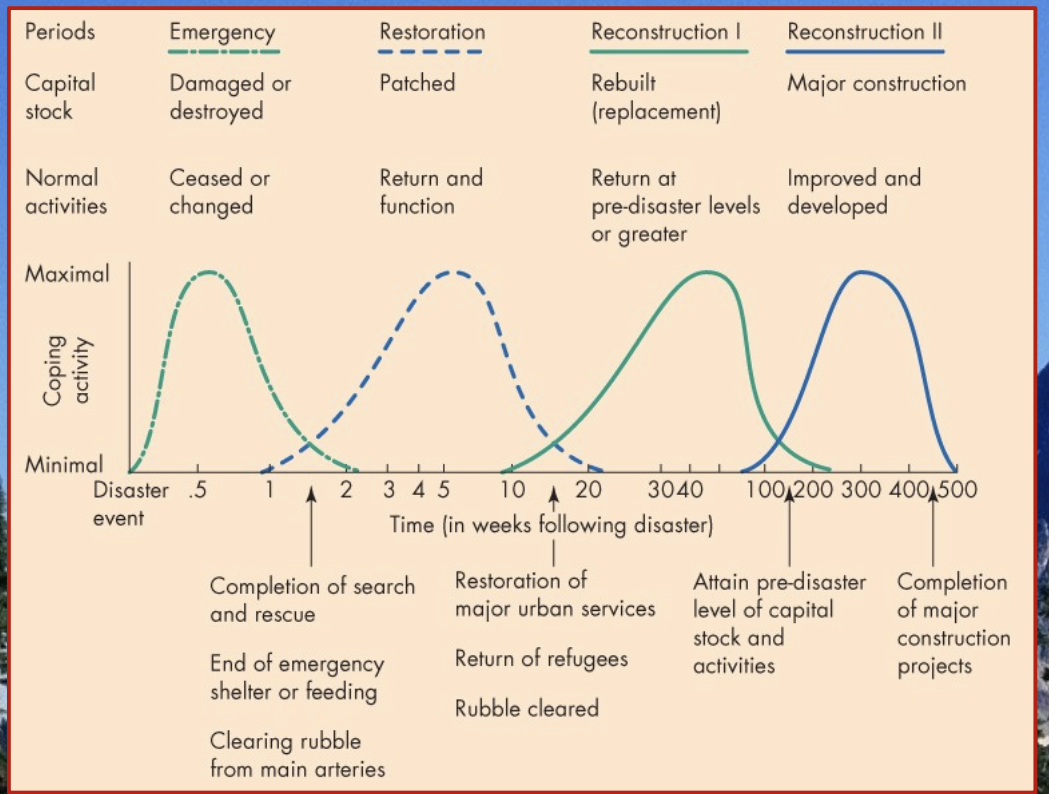
Model of disaster recovery
4 waves:
1. emergency
2. restoration
3. reconstruction 1
4. reconstruction 2
1. emergency
2. restoration
3. reconstruction 1
4. reconstruction 2
38
New cards
Perception of Hazard Frequency
Assuming that adjustment to a hazard is related to the perception of the hazard frequency, what do you feel is the probability
(0.0 = 0% chance and 1.0 = 100% chance)
of each of the following hazards occurring at some point here in London over the next 50 years?
* tornado
* hurricane
* flood
* ice storm
* blizzard
(0.0 = 0% chance and 1.0 = 100% chance)
of each of the following hazards occurring at some point here in London over the next 50 years?
* tornado
* hurricane
* flood
* ice storm
* blizzard
39
New cards
Factors affecting individual adjustment choices
__**Experience**__
* more experience with a hazard results in more likelihood of adjustment
\
__**Material wealth**__
* more resources results in more information and more options
\
__**personality**__
* some people are more likely to take risks. Some people have more confidence than others
* more experience with a hazard results in more likelihood of adjustment
\
__**Material wealth**__
* more resources results in more information and more options
\
__**personality**__
* some people are more likely to take risks. Some people have more confidence than others
40
New cards
Prospect Theory
In each example, which option do you prefer?
\
1. \
a) 1% chance of gaining $1000
b) 99% chance of gaining $100
\
2. \
a) 1% chance of losing $1000
b) 99% chance of losing $1000
\
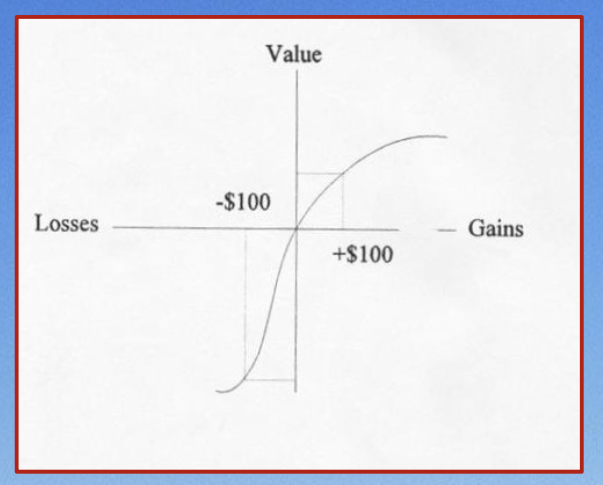
Generally, people are more willing to protect against a loss than they are willing to gamble on an equilivant gain
* we place a low value on any type of loss
* see diagram:
* curve is more steep on loss side
\
1. \
a) 1% chance of gaining $1000
b) 99% chance of gaining $100
\
2. \
a) 1% chance of losing $1000
b) 99% chance of losing $1000
\
Generally, people are more willing to protect against a loss than they are willing to gamble on an equilivant gain
* we place a low value on any type of loss
* see diagram:
* curve is more steep on loss side
41
New cards
Cultural adjustment
This type of adjustment may result from changes in an environment
\
example:
* Mackenzie River Delta
* the discovery of oil forced the local communities to adjust as the resource was developed
\
example:
* Mackenzie River Delta
* the discovery of oil forced the local communities to adjust as the resource was developed
42
New cards
Purposeful Adjustment
This is an adjustment that is specifically designed to reduce loss or damage
\
example:
* Designing buildings to withstand earthquakes in high risk areas
\
example:
* Designing buildings to withstand earthquakes in high risk areas
43
New cards
Incidental adjustment
\
\
These are not primarily hazard related, but they have the effect of reducing potential loss
example:
* advances in technology have improved warning systems
\
These are not primarily hazard related, but they have the effect of reducing potential loss
example:
* advances in technology have improved warning systems
44
New cards
Absorptive Capacity
This is a measure of the ability of people to sustain impacts from a hazard.
\
It results from combinations of cultural, purposeful, and incidental adjustments.
\
Example:
* In parts of Kenya, maize, beans, peas, sorghum, and ground nuts are all planted together
* This encourages deep roots among the plants, which results in a more drought resistant crop yield
\
It results from combinations of cultural, purposeful, and incidental adjustments.
\
Example:
* In parts of Kenya, maize, beans, peas, sorghum, and ground nuts are all planted together
* This encourages deep roots among the plants, which results in a more drought resistant crop yield
45
New cards
Cognitive influences on Choice
Based on 100 years of past data, the estimated probability of a 100-year tornado touching down in Disastertown in 2022 was 0.01.
\
In 2022 a tornado touched down in Disastertown.
\
The likelihood of a 100-year tornado touching down in 2023 is considerably less than 0.01 because one struck in 2022.
True or False?
* false
* the events are disjointed or exclusive
\
In 2022 a tornado touched down in Disastertown.
\
The likelihood of a 100-year tornado touching down in 2023 is considerably less than 0.01 because one struck in 2022.
True or False?
* false
* the events are disjointed or exclusive
46
New cards
Gambler’s Fallacy
The belief that the occurrence of a chance event influences the probability of future occurrences
eg.
* the chance of a ball landed on 25 is the same on every spin
eg.
* the chance of a ball landed on 25 is the same on every spin
47
New cards
Theory of choice
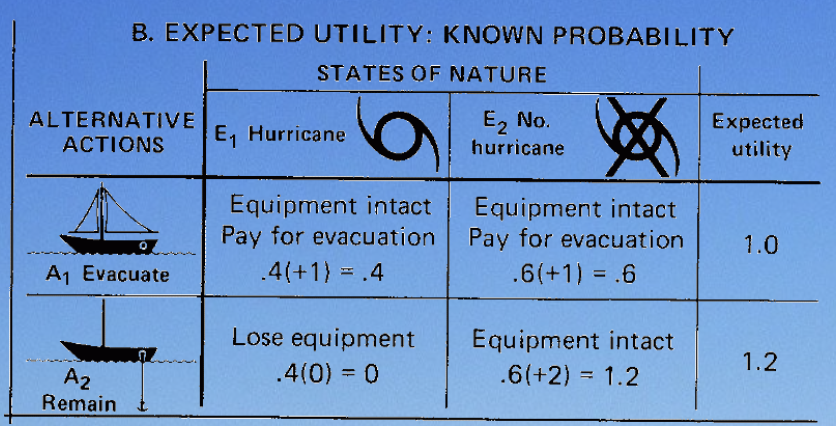
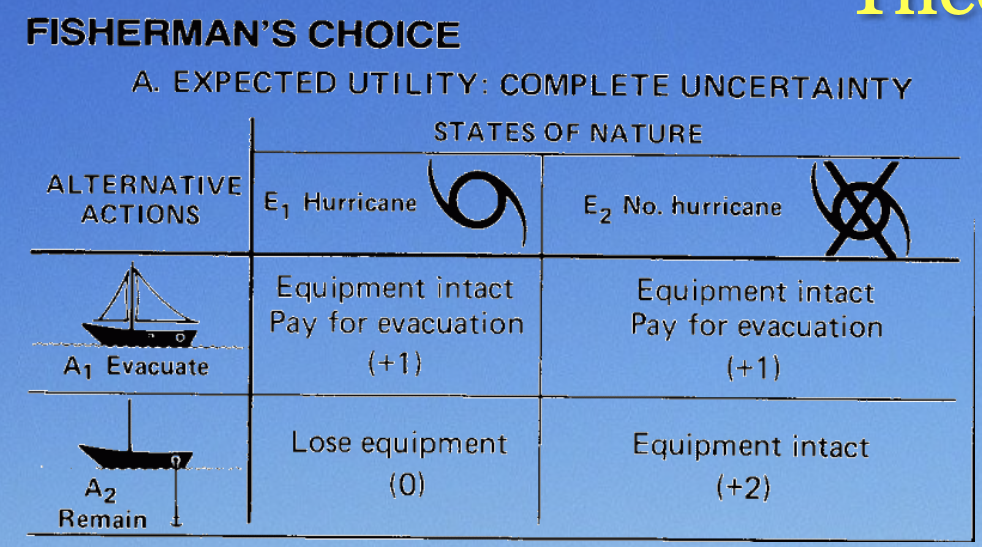
Based on the information, would you choose to evacuate or remain?
scenario probability
0 = worst
2 = best
\
1. take probability and multiply by original number
2. add up the numbers in the column
3. the highest number is the action you should take
\
\*this will be a question on the midterm
* check camera roll for another example
scenario probability
0 = worst
2 = best
\
1. take probability and multiply by original number
2. add up the numbers in the column
3. the highest number is the action you should take
\
\*this will be a question on the midterm
* check camera roll for another example
48
New cards
Expected Utility
optimize the values
* choose on the basis of all expected outcomes
* the probabilities are multiplied against assessments of value
* the probabilities are multipled against assessments of value
Potential issue:
Ascribing probabilities to events usually involves uncertainty
* choose on the basis of all expected outcomes
* the probabilities are multiplied against assessments of value
* the probabilities are multipled against assessments of value
Potential issue:
Ascribing probabilities to events usually involves uncertainty