ERTH303N Part 3
 Call Kai
 Learn
 Practice Test
 Spaced Repetition
 Match
 Flashcards
 Knowt Play
1/57

There's no tags or description
Looks like no tags are added yet.
58 Terms
Wall cloud
area of rotating clouds that extends downward beneath the updraft area of the mesocyclone
Funnel cloud
Rapidly spinning vortex that can emerge from the base of the wall cloud to form a tornado
EF scale (fujita)
Intensity of a tornado by the damage caused and a proxy for estimating wind speeds
Doppler radar
a specialized radar system that uses the Doppler effect (change in frequency) to measure the velocity, direction, and speed of objects like precipitation
Limitation: can only see ~ 200 miles from coast
Multiple vortex tornado
tornadoes that contain several smaller intense whirls called suction vortices that orbit the center of the larger tornado circulation.
Tornado alignment
from SW to NE because they develop just ahead of a cold front
Hurricane
tropical cyclonic storm having sustained minimum winds of 119 km/h (74 mph). form between 5-20° N/S latitude and need very warm ocean temperatures (>= 80 ° F).
Do not form near equator due to zero Coriolis force

Tropical systems (initiated by easterly waves)
– Thunderstorms
– Tropical squall lines/clusters
– Tropical depressions, storms, and hurricanes
Easterly waves
large migratory wavelike (east-west) disturbance in the trade winds

Tropical disturbance
organized mass of thunderstorms often with a very slight cyclonic wind circulation (< 23 mph)
Tropical depression
more organized cyclonic circulation (23 – 38 mph)
Tropical storm
sustained winds 39 – 73 mph; during this phase a name is given
Eye
circular area of relatively light winds, low pressure, and fair weather at the center of the hurricane
Eye wall
doughnut-shaped area of intense winds, thunderstorms, and precipitation surrounding the eye
Spiral rain bands
curved bands of clouds and precipitation that spiral inward towards the center of the hurricane
Hurricane cross section
image

Trade wind inversion (inhibits hurricanes)
forms in association with subsidence that occurs in regions associated with subtropical high; inhibits the development of strong thunderstorms
Hurricane decay
• Movement over cooler water
• Movement over land—storm loses its source of warm, moist air
• Strong upper level winds— can tear hurricanes apart
Saffir-simpson scale
ranks the intensity of hurricanes based on a scale from 1 – 5 (i.e.—5 categories)
Storm surge
abnormal rise of water generated by a storm over and above the predicted astronomical tides. product of cyclonic winds
Data buoys
Only means of continuous direct measurement of surface conditions over ocean areas
Galveston hurricane
• Landfall on 9/8/1900
• Category 4 (145 mph winds)
• Deadliest in U.S. history (8000 killed)
• Storm surge > 15 ft; city on 8.7 ft above sea level at the time
Hurricane andrew
• One of the costliest in U.S. history
• Category 5 (175 mph winds)
Hurricane Katrina (far from worst case)
• Costliest in U.S. history
• 1.2 Million evacuated
• > 1,800 deaths
• Category 5 at peak but hit as a Category 3
• Storm surge breached levees in New Orleans, submerging 80% of the city
Hurricane Sandy
deadliest and most destructive hurricane of the 2012 Atlantic hurricane season, as well as the second-costliest hurricane in United States history. Cat 3 at peak
Labor day hurricane
strongest winds probably exceeded 200 miles per hour
intensification of winds happened over a mere 36 hours
AMO
during warm phase: more hurricanes
during cool phase: less hurricanes
climate change means warmer waters and more hurricanes
Climate normal
30‐year average of a weather/climate variable (e.g.—temperature). Also includes degree days, probabilities, standard deviations, etc
Climate weirding
belief that climate change causes or will cause various weather‐related extremes to become more intense
Basic elements of W&C
– Temperature – Humidity – Type/amount of cloudiness – Air pressure – Type/amount of precipitation – Wind speed/direction
Tectonic scale climate change
climate change over intervals of millions of years
Orbital scale climate change
climate change over intervals of tens of thousands to hundreds of thousands of years
Millennial oscillation scale climate change
fluctuations in climate lasting thousands of years
Proxy data
tree rings, ice cores, ash beds, palynology, and corals—used by scientists to reconstruct past climates and environmental conditions
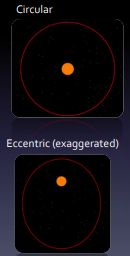
Eccentricity
refers the shape of Earth’s orbit around the sun (i.e.—how much the orbit is squashed)
every 100,000 yrs
Obliquity
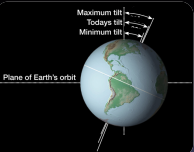
change in axial tilt of Earth with respect to its orbital plane
every ~41,000 yrs
Precession
wobbling of Earth’s axis, like a spinning top that is winding down
every 20,000 yrs

Milankovitch
Eccentricity, obliquity, and precession control ice ages
Fossilized pollen (palynology)
analyze pollen in dated lake sediment layers to produced records of past vegetation change
Last glacial maximum
118 – 21 kya. Ended by ~10 kya
time of glacial lake MSO

Medieval warm
increased solar radiation, reduced volcanic activity, and shifting ocean circulation patterns brought warmer temps
700‐1200 A.D
Little ice age
~1200 ‐1800 A.D. Varied regionally. Glaciers grow in Europe (1000 m lower than in 1850s)
Sunspot cycle
11-year cycle of solar activity driven by the sun’s magnetic field, where sunspot numbers rise to a "solar maximum" (high activity) and fall to a "solar minimum" (low activity)
Year without a summer
Tambora in 1815, together with an eruption from an unknown volcano in 1809, produced the “Year Without a Summer” (1816)
GCM garbage in-out
large-scale, low-resolution biases in GCMs propagate into regional models, rendering downscaling ineffective if the driving data is flawed. Subgrid-scale variability—physical processes smaller than grid cells (e.g., clouds, terrain)—causes significant uncertainty and requires parameterization
Global dimming
reduction in radiation at Earth's surface. Varies by location. Probably due in part to increased aerosol reflectance
Torrid, temperate, frigid zone
torrid near equator, warm, humid
temperate at middle latitude, cooler, not freezing
frigid at poles, icy climate

Koppen climate
Shows mean and monthly precip/temp. Simple, allows for nested, detailed data classes. Shows vegetation patterns
doesn’t include wind, extremes, intensity, insolation, cloud cover, causes

Thornwaite climate
depends on potential evapotranspiration. Useful for agriculture

Climograph
plots mean monthly temp in continuous line. Mean monthly precip is bars at bottom

GCM (global climate model)
Grid cells over globe. Garbage in, garbage out model. All processes are lumped into one cell
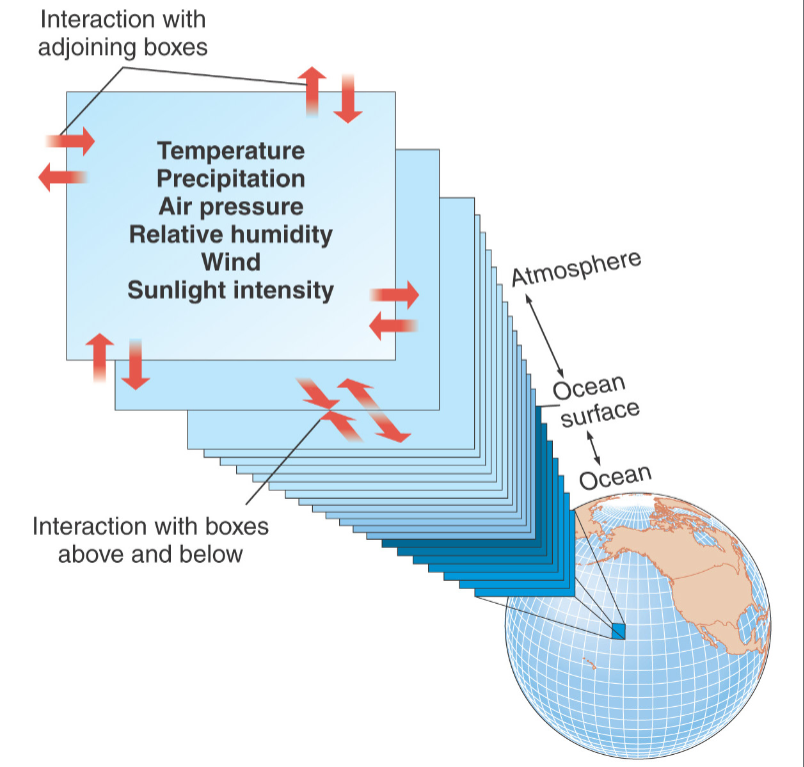
Regional modelling
examines smaller areas in more detail

2023 climate graph
image

IPCC
The IPCC is a scientific body under the auspices of the United Nations (UN). It reviews and assesses the most recent scientific information produced worldwide relevant to the understanding of climate change. It does not conduct any research nor does it monitor climate related data or parameters
6 assessment reports
in 1990, 1995, 2001, 2007, 2014, and 2021-23

Representative concentration pathways (RCP)
four main scenarios of total radiative forcing that occurs by 2100
Representative emission pathways (REP)
trajectories of emissions of GHGs, aerosols, land-use, etc., that are more nuanced
downburst, microburst, macroburst
down: localized downdraft with straight-line concentrated bursts of wind (evaporative cooling)
microburst: downburst with a diameter < 4 km for 2-5 min
macroburst: downburst with a diameter < 4 km
