3.3.1: Progressive and Stationary Waves
 Call Kai
 Learn
 Practice Test
 Spaced Repetition
 Match
 Flashcards
 Knowt Play
1/6

There's no tags or description
Looks like no tags are added yet.
7 Terms

Explain what this displacement-distance graph shows?
This is a snapshot of the wave at a particular time, showing the amplitude, crest, trough and wavelength

Explain what this displacement-time graph shows?
This shows how part of the wave varies over time. Where the wavelength would have been is now the time period, but the amplitude remains the same

What does this show?
The wavefront of plane waves

What does this show?
The wavefront of circular waves
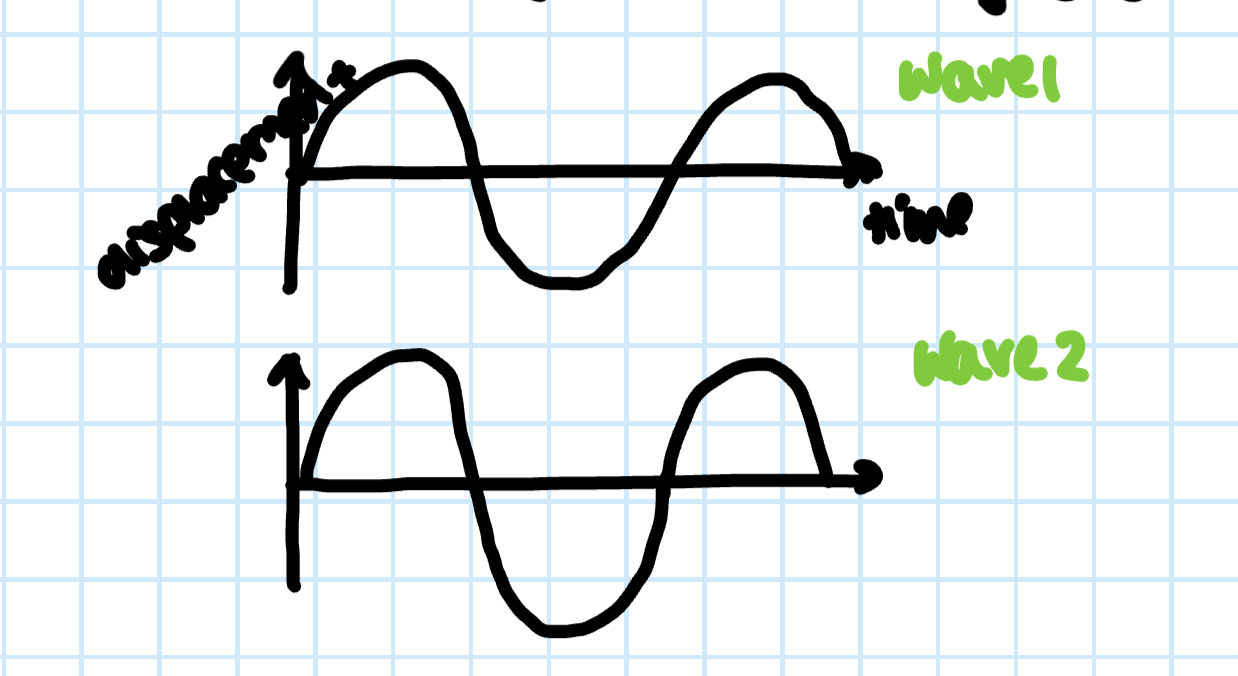
What does this show?
Two waves in phase with each other.

What does this show?
Two waves that are antiphase or have a 180 degree phase difference with each other

How could you describe the relationship between the purple and green wave?
The purple wave is said to lag behind the green wave by ¼ λ