Economics Test 2026
 Call Kai
 Learn
 Practice Test
 Spaced Repetition
 Match
 Flashcards
 Knowt Play
1/61

There's no tags or description
Looks like no tags are added yet.
62 Terms
The Economic Problem
The fundemental challenge facing all societies, which is how to satisfy unlimited wants with limited resources. Because resources such as land, labour and capital are scarce (in short supply), people and societies must make choices about how to allocate them.
Needs
Essential goods/services for human survival.
Wants
Goods/wants that are unnecessary for survival but are human desires
Needs vs Wants
Needs are goods and services essential for survival, such as food, water, clothing and shelter. Wants are goods and services people desire but do not need to survive, such as designer bags, gaming consoles and luxury cars.
Three questions used to solve the economic problem
What to produce - making decisions about how resources should be allocated so that the right types and quantities of goods or services are produced.
How to produce - the best types of production methods to be used in making goods and services.
Who to produce for – how the good and services that are produced are shared between individuals.
Scarcity
The basic economic problem caused by limited resources and unlimited wants. It forces individuals, businesses and governments to make choices about how to allocate resources to satisfy their needs and wants.
Opportunity Cost
The lost alternative use that the economic resources could have been allocated to.
Opportunity Cost Example
A frozen dessert business choosing to produce icy poles over ice-cream. The opportunity cost is to forgo (give up) the production of and profits from the sale of ice-cream.
Trade-off
Giving up multiple alternatives when making a decision.
Trade-off Example
Trade-Off: Spending money on a new phone means giving upbuying new clothes, saving money, or going to a concert.
Opportunity Cost: The value of the best thing you gave up (e.g.,the concert).
Four factors of Production
Land: Includes any natural resource
Labor: The effort that humans contribute
Capital: Includes machinery, tools and buildings
Entrepreneurship: Combines land, labour and capital in new ways
Circular Flow Model
Households– The Australian population. They make decisions about spending, as well as supply or sell resources to the business sector (e.g. provide labour).
Businesses – All businesses in Australia. They buy resources from households to produce goods and services and provide households with income in return.

Material Living Standards
Material living standards focus on economic wellbeing e.g. income and access to goods and services.
Non-material living standards
Focus on quality of life factors such as happiness and the environment.
Material Living Standards Examples
Income per person
Level of consumption of goods and services per person
The purchasing power of incomes
Non-material Living Standards Examples
The quality of daily life:
Happiness
Freedom
Quality of Relationships
Mental and physical health
Factors that affect living standards
Inflation: High inflation means that people are able to buy less with the same money as they could before, resulting in them having to sacrifice some of their wants, decreasing the level of consumption per person. This could also cause higher levels of stress and lower levels of happiness
Interest Rates: An increase in interest rates discourages people from taking out loans and spending their money and encourages them to save. This could decrease their level of consumption per person and potentially cause them more stress as they have to rethink their spending.
Unemployment
Results when the economy is unable to generate enough jobs who are willing and able to work. According to the ABS ( Australian Bureau of Statistics), for a person to be unemployed, they must be over the age of 15, actively seeking work and not currently working.
Seasonal Unemployment
People are out of work at certain times of the year due to seasonal demand (e.g., tourism workers)
Structural Unemployment
There is a mismatch between the skills workers have and the skills employers need
Cyclical Unemployment
Due to changes in the economic cycle; when demand is low, workers are not in high demand
Frictional Unemployment
The time between a worker leaving one job and beginning the next
Long-term Unemployment
Unemployed for a long duration, despite having skills and seeking work
Unemployment has an impact on
Wages that are paid, level of consumer spending, economic growth, and standard of living
High unemployment levels are sign of poorly performing economy because:
Income tax revenue falls, government expenses rise, increased rates of crime, strain on families, economic activity decline in some geographical areas (e.g., regional towns) , sale of personal effects (items).
GDP
Gross Domestic Product. It measured by adding together the total amount of goods and services produced in a country during a year.
Explain how GDP is used to measure economic growth
Comparing GDP across different years is how economic growth is measured. Economic growth is an increase in the size of a country’s economy over time.
The link between GDP, employment and inflation
GDP and employment: When GDP increases, businesses produce more goods and services, so they need more workers. This increases employment and reduces unemployment.
GDP and inflation: When GDP grows too quickly, demand for goods and services may exceed supply, causing prices to rise and increasing inflation.
Define/Outline/Describe the meaning
1–2 marks per concept.
Accurately state the meaning of a concept/term.
If it is a two-mark question, you will require a more in-depth understanding — e.g. stating characteristics, providing an example.
Outline/Explain/Analyse Relationship
2–4 marks.
This involves either:
Showing cause (x) and effect (y).
Explaining how x impacts y.
What is x?
Show the relationship between x and y.
What is the outcome (how is y impacted by x)?
Describe/Explain the data
Demonstrate understanding of trends in graphs/statistics.
Your response will require you to:
Identify what the data is depicting.
Describe the trend (e.g. rise/fall/stable).
Refer to specific figures.
If there are multiple concepts being measured, comment on the relationship (e.g. when x increases, y decreases).
When being asked to explain the data, you need to provide a reason for a trend (e.g. a potential reason for the increase in inflation is lower unemployment levels).
Inflation
Inflation is a general increase in the level of prices throughout the economy.
How is inflation measured
The most commonly used measure of inflation is the Consumer Price Index (Or CPI).
Healthy Inflation Rate according to the Reserve Bank of Australia (RBA)
2-3%
Causes of Inflation
The demand for goods and services in the economy exceeds the economy’s ability to produce them
The rising price of input goods and services increases the price of final goods and services
Unemployment increases
Effects of Inflation
Unanticipated inflation decreases the purchasing power of consumers (the same amount of money buys less than it previously did).
A high average rate of inflation is always accompanied by much uncertainty about the future inflation rate
Greater levels of risk increase the value of the “option to wait,” which delays many consumption and investment decisions, and thereby slows economic growth.
Interest rates
An interest rate is the cost of borrowing money or the benefit gained through saving money.
Function of interest rates in the economy
If inflation is high, the RBA usually raises interest rates to slow down spending (less incentive to borrow, more incentive to save)
If the economy is slow, the RBA usually lowers interest rates to encourage borrowing and spending.
How Interest Rates Affect Saving and Borrowing

Globalisation
The increasing connection and interdependence of countries through trade, communication, transport, and technology.
Trade
The buying and selling of goods and services between people, businesses, or countries.
Imports
An import is a good or service that a country buys from another country.
Exports
An export is a good or service that a country sells to another country.
Why does trade occur?
No country can make everything it needs. Therefore, trade gains access to goods that would otherwise not be available
Trading allows countries to focus on what they do best. Eg. Australia specialises in livestock due to land availability and high safety standards, while China specialises in clothing due to low labour costs. By trading, both countries benefit from each other’s advantages.
Lower costs Eg. If Australia had to make all its own clothing, the price of clothes would increase as labour costs are higher in Australia.
Benefits of trade
Countries can specialise in producing goods and services they’re best at.
Access to a wider range of products for consumers (e.g. electronics, fashion, food).
Larger markets for Australian businesses to sell to.
Challenges of Trade
Over-reliance on one country (e.g. China) can be risky if relations change.
Currency fluctuations affect the cost of imports and exports (e.g. if AUD drops, imports become more expensive).
Global events (like wars or economic crises) can make trade unstable or more difficult.
What are Australia's major exports?
Iron ore, coal, natural gas, gold, agricultural products (e.g. beef and wheat)
What are Australia's major imports?
Cars, electronics, machinery, clothing, medicines
Who are Australia's major trading partners?
China, Japan, the United States, South Korea and India.
Supply
Supply refers to the quantity of a good or service that producers are willing and able to offer for sale at different prices over a period of time.
Demand
The willingness and ability to buy a good/service at a particular price.
Law of Supply
As the price of a product rises, the quantity supplied also rises, assuming all other factors remain constant.
Law of Demand
As price increases, demand decreases (and vice versa), assuming all other factors remain constant.
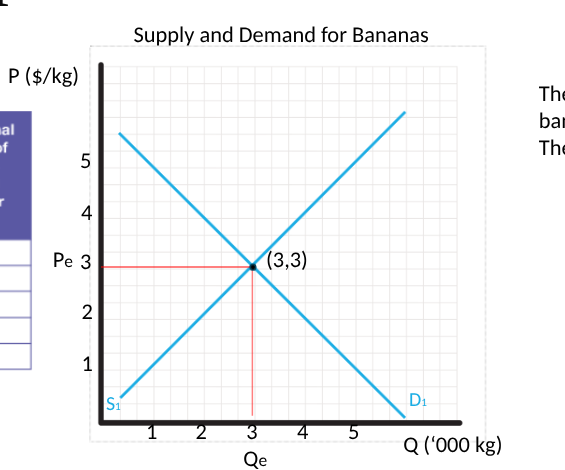
How to make a supply/demand graph

Elements of a supply and demand graph
Title (what is the graph showing) – Supply and Demand of __________
X and Y axes. X axis is for Quantity (Q) and Y axis is for Price (P)
Make sure both axes are labelled accurately and specifically. E.g. Q ($/kg)
Supply curve and demand curve. Labelled as S1 and D1 respectively.
Equilibrium Price and Quantity labelled.
Relationship between supply, demand and price

Shortage
Demand is larger than Supply → upward pressure on price.
Surplus
Supply is larger than Demand → downward pressure on price.
Land
All natural resources used in the production of goods and services, such as water, forests and minerals.
Labour
The physical and mental effort of people used in the production of goods and services.
Capital
Human-made resources used to produce goods and services, such as machinery, tools and equipment.
Entrepreneurship
The ability to combine the other three factors of production, take risks and organise production to create goods and services.