Ch. 5 - Data Visualization
 Call Kai
 Learn
 Practice Test
 Spaced Repetition
 Match
 Flashcards
 Knowt Play
1/23

Earn XP
Description and Tags
230-268
24 Terms
plots should do the following
show the data
induce the reader to think about the data being presented
avoid distorting the data
present many numbers with minimum risk
make large data sets
encourage the reader to compare different pieces of data
reveal underlying message of the data
chartjunk
distracting visual elements in a chart or graph
fail to communicate quantitative data clearly
boxplot
median at the center of the plot
box at the top & bottom of the statistic
boxes = limits within whch the middle 50% of observations fall (IQR)

three types of boxplots
1d boxplot
simple boxplot
clustered boxplot
clustered boxplot
splits data by a second categorical variable
boxplots for this second variable are produced in different colours
simple boxplot
multiple boxplots for the chosen outcome
splitting the data by a categorical variable
1d boxplot
single boxplot of all scores for the chosen outcome
simple bar
means of scores across different groups or categories of cases
clustered bar
different coloured bars to represent levels of a second grouping variable
stacked bar
different coloured bars are stacked on top of each other
simple 3d bar
second grouping variable is displayed by an additional axis
clustered 3d bar
add a third categorical variable on an extra axis
simple error bar
mean is represented by a dot
lien represents the precision of the estimate of the mean
clustered error bar
mean displayed as a dot with an error bar around it
line charts
bar charts but with lines
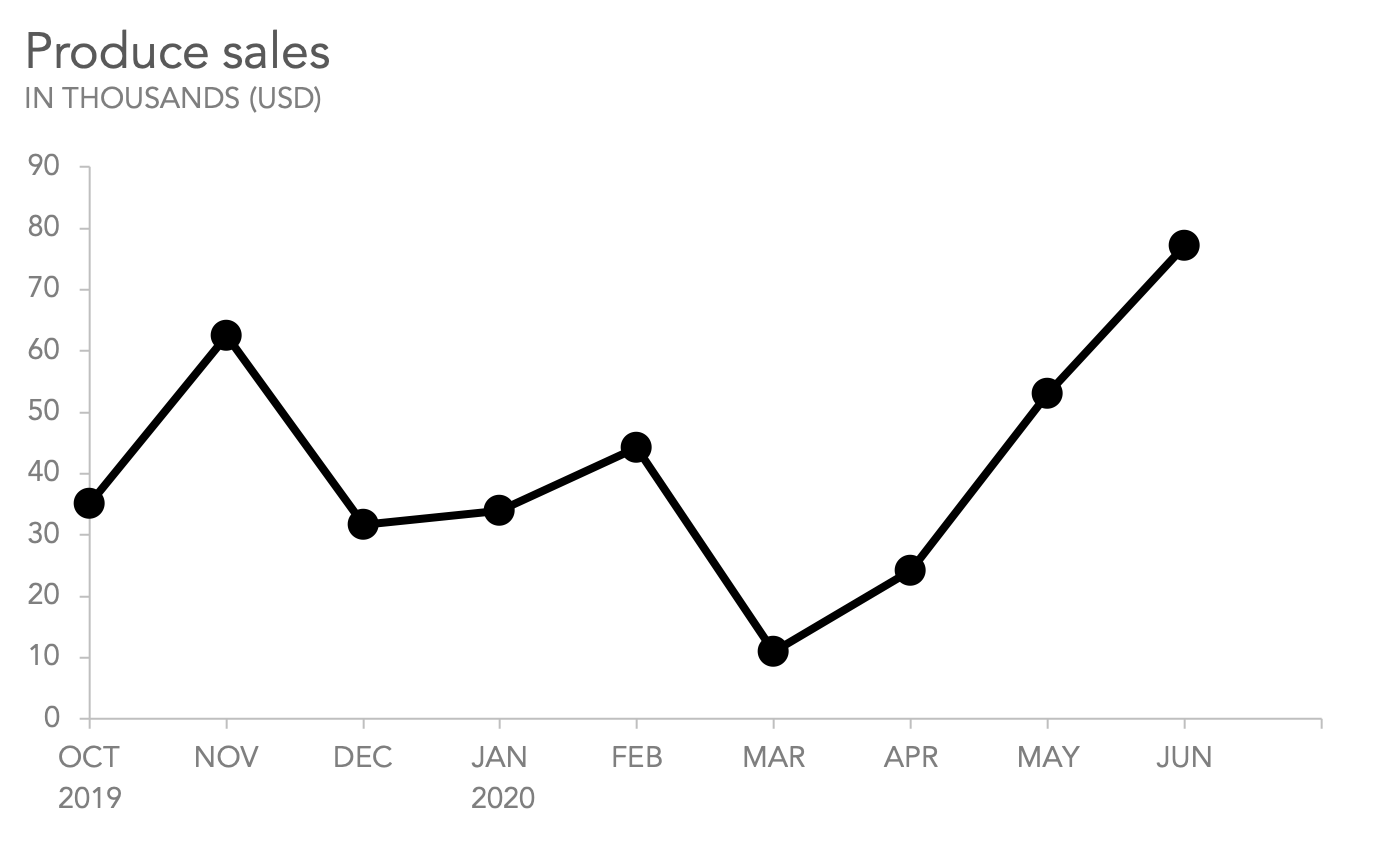
simple line
display the means of scores across different groups of cases
multiple line
equivalent to clustered bar chart
plot means of an outcome variable for different categories/groujps of a predictor variable
produce different coloured lines of each category/group
scatterplot
plot each entity’s score on one variable against their score on another
visualizes relationship between the variables
simple dot plot/density plot
like a histogram
individual scores displayed as dots
shape of the distribution of scores