statistics 1
 Call Kai
 Learn
 Practice Test
 Spaced Repetition
 Match
 Flashcards
 Knowt Play
1/45

There's no tags or description
Looks like no tags are added yet.
46 Terms
univariate data
one measured variable
sex is a nominal variable or factor with (?) levels
2

bivariate data
two measured variables

one way ANOVA
univariate data
one factor with many levels
are nominal variables controlled by the experimenter?
no

two way ANOVA
one measured variable
two factors with many levels
number of factors = number of controlled variables
how is the number of groups calculated in two way ANOVA?
number of levels in factor 1 x number of levels in factor 2
groups and levels are interchangeable terms in a (?) ANOVA
one-way


how many groups in this two way ANOVA
factor 1 = disease (control vs obstructive) = 2 levels
factor 2 = dose = 5 levels
2 × 5 = 10 groups

t-test is used to measure univariate data with:
1 factor and 2 levels
one way ANOVA is used to measure univariate data with:
1 factor and many levels
two way ANOVA is used to measure univariate data with:
1 factor and many levels
paired t-test vs unpaired t-test
paired → uses same group of participants
unpaired → uses different groups of participants (independent)
what are the two types of unpaired t-tests?
Student’s and Welch’s
what are the two types of one way ANOVAs?
independent samples → e.g. disease (diseased vs non diseased participants)
repeated measures → e.g. dose (each participant receives each dose)
what are the three types of two way ANOVAs?
independent samples → both factors
repeated measures → both factors
mixed design → one factor is independent samples, one is repeated measures

interaction
no interaction → effect of factor 1 was same for all levels of factor 2
interaction → effect of factor 1 was different between levels of factor 2
if the graphs are parallel → no interaction
main effects
the effect of a controlled variable on the measured variable
robust test
t-tests are very reliable
won't give false positives or negatives
results remain unaffected with minor data shifts
fragile test
asssumptions must be rigorously applied
results change easily with minor data shifts
useless for repeated measures → minor deviations produce large errors
normal distribution
symmetric data pattern that is centered around an average value
both paired and unpaired t-test assumes (?) distribution
normal
paired t-tests are correlated: what does this mean?
describes the size and direction of a relationship between two or more variables
test for correlation (normal distribution)
Pearson’s r
student’s t-test
unpaired t-test
groups are independent
assumes equal variance
what is the test for equal variance between two levels?
Fisher’s F test
welch’s t-test
unpaired t-test
groups are independent
does not assume equal variance
independent samples ANOVA vs repeated measures ANOVA
both normally distributed
independent samples ANOVA → same variance between groups
repeated measures ANOVA → constant sphericity
what is sphericity?
correlation of all groups are identical
differences between groups must have equal variance
what test’s assume normality? (list 5)

what is homoscedasticity?
assumption of equal variance
student’s t-test and independent sample ANOVA are (?) to deviations from homoscedasticity?
robust
repeated measures ANOVA assumes (?) and is (fragile/robust?)
sphericity
fragile to deviations from sphericity
robust to deviations from normality
Greenhouse-Geisser epsilon is a measure of (?)
sphericity
compound symmetry
sphericity where all variances and covariances are the same
how to determine when to use non-parametric test
plot a frequency histogram
indicator of skew and kurtosis
skew → 0 normal
kurtosis → 0 normal
test for normality
e.g. Shapiro-Wilk test
p<0.05 → not normal
normality plots
data points should fall linearly

why is using parametric tests ok for when there are small abnormalities?
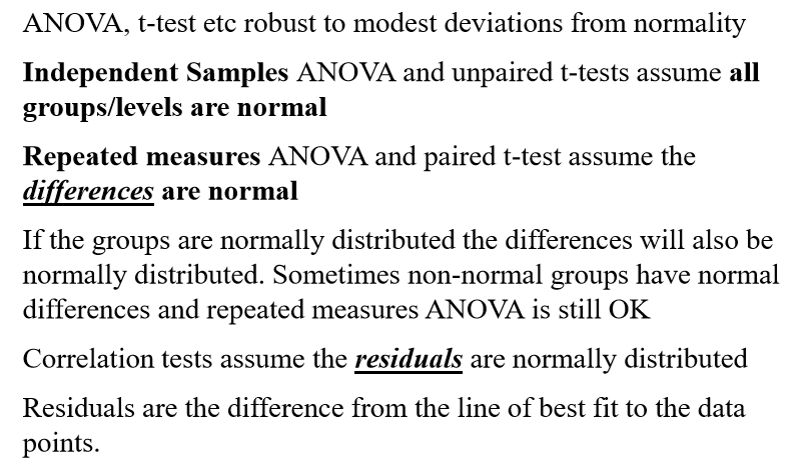
ANOVA and t-tests are robust to deviations from normality
independent samples ANOVA and unpaired t-tests assume all groups/levels are normal
repeated measures ANOVA and paired t-test assume the differences are normal
non-parametric tests (parametric test equivalents)

non-parametric tests
do not assume normal distribution
assumes big differences in variance deviations
parametric tests use size, non-parametric tests use (?)
ranks
non-parametric tests use (? and ?) instead of mean and standard deviation
median
IQ (interquartile range)
when to use non-parametric tests (list 6)

semi-quantitative data
uses non-parametric testing
variable is ranked not quantitatively measured
summary

summary

define
